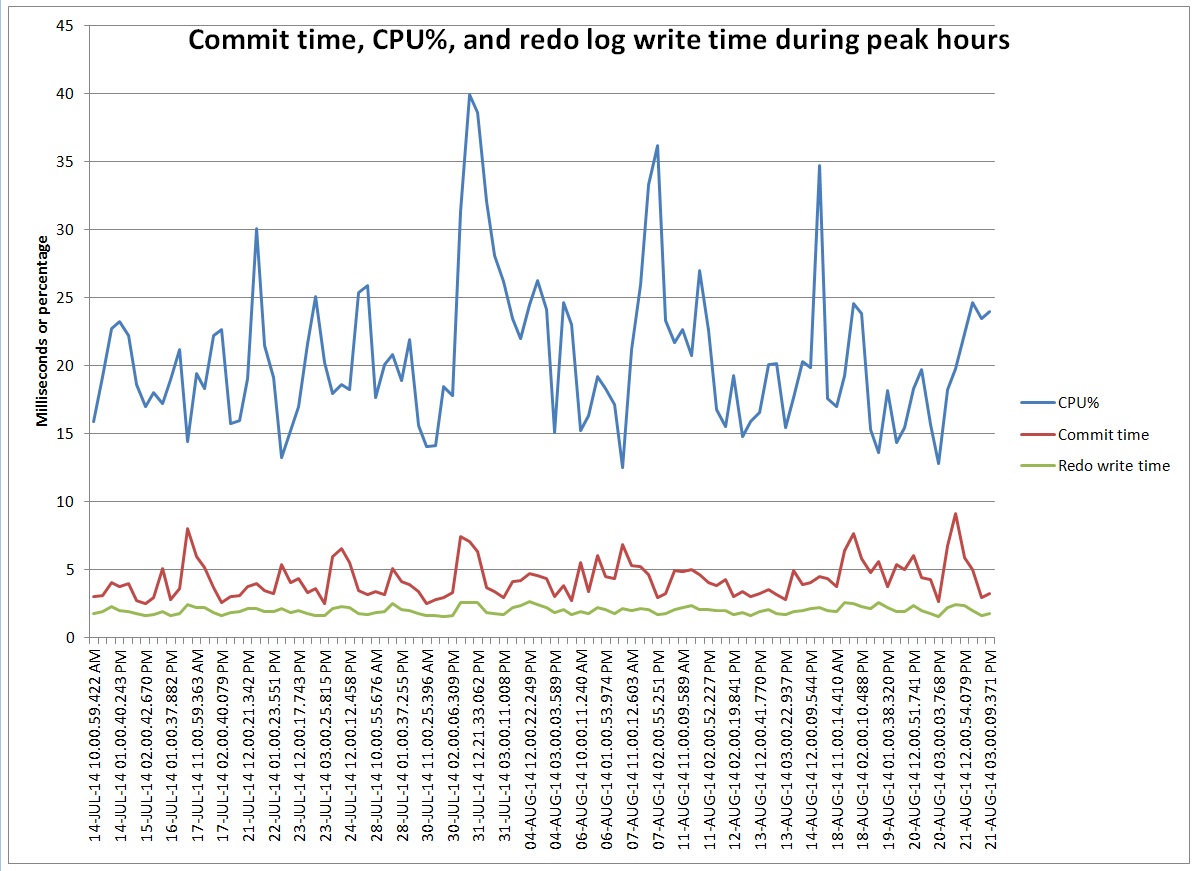
I have an example of paging in some Exadata OS Watcher log files. We got an error in the alert log about a high load but reviewing AWR reports it did not seem like we had an unusual number of active sessions. Also, the CPU use seemed low but the system load was high. Reviewing the OS Watcher logs and finding a similar case on Oracle’s support site convinced me that our issue was due to a large amount memory being paged out to the swap file.
Here is the top report from the problematic time:
top - 11:07:58 up 239 days, 14:57,  0 users,  load average: 204.84, 183.48, 106.74
Tasks: 1097 total,  71 running, 1022 sleeping,   0 stopped,   4 zombie
Cpu(s):  1.3%us, 98.0%sy,  0.0%ni,  0.2%id,  0.5%wa,  0.0%hi,  0.1%si,  0.0%st
Mem:  74026796k total, 72456380k used,  1570416k free,     2436k buffers
Swap: 16771852k total,  7884656k used,  8887196k free,   597336k cached

  PID USER      PR  NI  VIRT  RES  SHR S %CPU %MEM    TIME+  COMMAND
  894 oracle    15   0  324m  26m  10m S 309.1  0.0 129:46.34 /u01/app/11.2.0.2/grid/bin/diskmon.bin -d -f
 1053 root      20  -5     0    0    0 R 100.0  0.0  32:10.62 [kswapd0]
 3366 oracle    16   0 1440m  54m  18m S 146.6  0.1   3:03.54 /u01/app/11.2.0.2/grid/bin/oraagent.bin
23809 oracle    18   0  992m 179m  16m S 128.1  0.2 158:45.67 /u01/app/oracle/Middleware/agent11g/bin/emagent
28878 orarom    18   0  982m 360m  11m S 101.5  0.5  94:58.36 /opt/OracleHomes/agent_home/core/12.1.0.3.0/jdk/bin/java -Xmx154M -XX:MaxPermSize=96M -se
 4501 oracle    19   0 4423m  96m  24m R 89.6  0.1   2435:54 ora_dia0_ourprdfs1
18318 oracle    20   0 26.3g 610m  70m R 86.3  0.8   2025:17 ora_p001_ourprd1
18226 oracle    18   0 26.3g 595m  61m D 82.3  0.8 212:20.62 ora_p013_ourprd1
 7619 oracle    19   0 1727m  16m  14m R 80.5  0.0   0:50.29 oracle+ASM1 (LOCAL=NO)
 4389 oracle    25   0 25.9g 158m  27m R 78.5  0.2   2557:06 ora_dia0_ourprd1
11008 oracle    18   0 26.3g 561m 133m D 77.9  0.8 373:34.37 ora_p010_ourprd1
 8484 root      25   0  238m 6276 2600 R 77.3  0.0   0:46.60 python /usr/local/bin/dcli -s -q -l root -g cell_group exec 2>&1; cellcli -e list quaranti
 7937 oracle    18   0 26.3g 603m  86m R 76.5  0.8   1656:21 ora_p021_ourprd1
24118 oracle    25   0 26.3g 602m 103m R 72.7  0.8   2997:08 ora_p007_ourprd1
 4491 oracle    16   0 5912m 121m  25m D 72.6  0.2   2407:59 ora_dia0_obrprd1
 7919 oracle    25   0 26.4g 680m 247m R 72.2  0.9   4256:57 ora_p011_ourprd1
 4384 oracle    18   0 4407m  95m  25m D 70.8  0.1   2344:36 ora_dia0_otrprd1
 4397 oracle    23   0 25.8g  44m  23m D 69.5  0.1   1695:21 ora_lmd0_ourprd1
 2548 oracle    20   0 1809m 116m  44m R 69.3  0.2   2393:41 asm_dia0_+ASM1
Note the load of 204 and the system cpu % of 98%. By 11:07 CPU utilization had gone back up so I assume that the swapping I/O had completed but then a bunch of system I/O kicked off. Also I assume that [kswapd0] has something to do with swapping. Here is the mpstat report:
             CPU   %user   %nice    %sys %iowait    %irq   %soft  %steal   %idle    intr/s
10:59:00     all    3.49    0.00    2.05   93.81    0.01    0.16    0.00    0.48   4144.00
10:59:05     all    4.94    0.00    2.45   92.21    0.01    0.11    0.00    0.28   2548.00
10:59:16     all    1.42    0.00    1.82   95.64    0.02    0.13    0.00    0.97   3108.66
10:59:21     all    3.84    0.00    3.58   90.68    0.04    0.49    0.00    1.38   3868.40
10:59:26     all    1.99    0.00    1.85   93.56    0.01    0.13    0.00    2.46   2942.48
10:59:31     all    1.38    0.00    1.85   91.37    0.01    0.10    0.00    5.29   2479.04
10:59:36     all    1.75    0.00    2.81   94.19    0.01    0.16    0.00    1.08   2762.60
10:59:41     all    0.89    0.00    1.09   97.41    0.00    0.05    0.00    0.56   2116.80
10:59:46     all    1.19    0.00    1.21   93.91    0.03    0.11    0.00    3.55   2992.40
10:59:51     all    1.79    0.00    1.75   95.88    0.01    0.28    0.00    0.29   3820.00
10:59:56     all    2.09    0.00    1.55   92.85    0.03    0.21    0.00    3.28   4410.80
11:00:01     all    1.85    0.00    1.91   96.00    0.01    0.11    0.00    0.11   3433.47
11:00:06     all    1.50    0.00    1.45   89.07    0.01    0.11    0.00    7.85   3746.00
11:00:11     all    6.41    0.00   10.68   80.29    0.09    0.80    0.00    1.73   9269.46
11:00:16     all   17.14    0.00   19.42   57.12    0.14    0.83    0.00    5.35  17018.64
11:00:21     all    8.58    0.00   80.85    9.01    0.05    0.23    0.00    1.29   6951.70
11:00:27     all    6.21    0.00   91.77    1.12    0.04    0.09    0.00    0.78   5417.11
11:00:32     all    5.65    0.00   93.75    0.53    0.01    0.04    0.00    0.02   3289.82
11:00:38     all    2.72    0.00   96.81    0.35    0.01    0.02    0.00    0.09   2480.87
11:00:44     all    1.73    0.00   97.89    0.28    0.00    0.02    0.00    0.08   1745.89
11:01:00     all    1.85    0.00   97.72    0.16    0.01    0.04    0.00    0.22   2710.93
11:01:05     all    0.79    0.00   98.84    0.25    0.00    0.04    0.00    0.09   2543.39
11:02:23     all    1.00    0.00   98.72    0.15    0.00    0.02    0.00    0.10   1558.00
11:02:33     all    0.95    0.00   98.74    0.09    0.00    0.09    0.00    0.13   1488.49
11:02:39     all    1.64    0.00   98.13    0.08    0.01    0.05    0.00    0.08   1441.73
11:02:44     all    0.46    0.00   99.29    0.10    0.00    0.09    0.00    0.06   1465.73
11:03:20     all    1.54    0.00   97.96    0.25    0.01    0.07    0.00    0.17   2757.95
11:03:25     all    0.40    0.00   99.24    0.21    0.00    0.02    0.00    0.12   1550.60
11:03:30     all    0.39    0.00   99.22    0.23    0.00    0.01    0.00    0.15   1421.20
11:03:35     all    3.29    0.00   96.32    0.25    0.01    0.03    0.00    0.10   1952.51
11:03:40     all    5.90    0.00   93.76    0.28    0.00    0.01    0.00    0.05   1407.00
11:03:45     all    1.14    0.00   98.56    0.20    0.00    0.01    0.00    0.09   1418.00
11:03:50     all    0.19    0.00   99.55    0.21    0.00    0.03    0.00    0.03   1356.69
11:04:23     all    0.36    0.00   99.31    0.18    0.00    0.04    0.00    0.10   1621.67
11:06:13     all    0.58    0.00   99.13    0.14    0.00    0.04    0.00    0.11   1550.73
11:06:18     all    3.32    0.00   96.36    0.23    0.00    0.04    0.00    0.06   2055.30
11:06:24     all    4.39    0.00   95.32    0.24    0.00    0.02    0.00    0.03   1991.53
11:06:31     all    4.14    0.00   95.48    0.28    0.01    0.02    0.00    0.07   1598.53
11:07:21     all    1.38    0.00   98.32    0.19    0.00    0.01    0.00    0.09   1444.49
Notice how it is almost all IO until around 11 am and then it switches to all system cpu%. I assume the I/O was swapping memory out. The meminfo report has these numbers:
zzz ***Mon Sep 1 11:00:11 CDT 2014
MemTotal:     74026796 kB
MemFree:        330888 kB
...
SwapTotal:    16771852 kB
SwapFree:      8153352 kB
I take this to mean that we have about 330 meg free out of 74 gig total, but still 8 gig of swap. Presumably when free memory gets low then idle processes get swapped out. A member of our Unix team pointed out the swapping on the vmstat output. Here is a section that shows a lot of pages getting swapped out (so). Each line represents 5 seconds and I think it starts 10:57:56.
zzz ***Mon Sep 1 10:05:31 CDT 2014 Sample interval 5 seconds
-- deleted 629 lines = 629*5 seconds = 3145 seconds
-- 10:57:56 am
procs -----------memory---------- ---swap-- -----io---- --system-- -----cpu------
 r  b   swpd   free   buff  cache   si   so    bi    bo   in   cs us sy id wa st
86 16 7567956 328800    800 610940   56 5350   157  5381 1626 10013  4 96  0  0  0
44 32 7602804 327956    996 613940  222 10464   554 10510 2177 13818  0 99  0  0  0
 1 109 7632732 330412   2284 619780  290 7986  1738  8130 3382 14002  1 21  7 70  0
35 41 7702076 353744   2504 621392  623 16054  1290 16206 8776 19234  2  3  2 92  0
 1 103 7749296 327480   2692 622004  422 11307   789 11574 3839 16138  3  2  1 94  0
 4 109 7849812 330972   3036 624808 1974 24691  2844 25110 11705 36080  4  3  1 92  0
 0 66 7869628 346228   3108 626444  859 6309  1055  6309 5538 16922  3  1  1 94  0
23 104 7895176 1998796   3300 624864 1032 7582  1283  7784 4032 24443 56  3  1 40  0
 3 90 7918016 328212   4144 632880 4910 5939  6866  6406 13908 47820 40  8  3 49  0
 1 101 7983136 333008   4480 627416 1180 15655  1523 15960 3977 16945  5  3  1 91  0
 1 125 8033148 327376   4712 628312  922 12213  1302 12295 3545 16946  4  3  0 93  0
 1 141 8072048 329060   4856 626976  764 10862   986 11082 3684 21305  2  1  1 96  0
 2 76 8106056 327556   5056 627124  797 8855  1048  8946 3968 15044  2  2  0 96  0
 0 103 8181216 328348   5284 611140 2415 16583  3076 16938 4374 17445  4  5  2 90  0
 4 92 8222500 330044   5408 610708 1470 9698  1874  9898 2842 15110  2  2  2 94  0
 4 94 8285204 328932   5936 614128 1015 14754  1678 15213 3324 18240  2  2  5 91  0
 1 111 8326908 327348   6184 614600 1034 9759  1465 10012 2577 14809  2  2  1 95  0
 1 119 8338520 328352   6332 616076  610 4896   834  4952 2505 15373  1  1  1 97  0
 0 98 8378304 329308   6536 615944  975 9795  1334  9931 3802 15897  2  2  3 93  0
 0 89 8404456 327204   6800 618872 1232 8327  1662  8413 4557 16856  2  2  2 94  0
 0 123 8430092 327272   7092 619016 1004 7379  1393  7672 2852 14689  1  1  2 96  0
 1 92 8453420 327212   7284 622700 1738 7250  2259  7494 4241 17781  2  2  2 94  0
 7 76 8562308 329132   7860 628932 2616 23847  3409 25162 6833 20938  4  7  7 82  0
 5 60 8691628 334124   7012 635948 6066 28059  8119 32201 13584 32154 15 23  1 61  0
63 37 8683600 327404   2812 582200 8138  661 12947  2870 12507 26754 12 44  6 38  0
98 22 8696516 328056   1260 560572 10494 7070 15550  9394 28854 128944  3 96  0  0  0
72 14 8694008 327148   1960 557616 1693    3  3222   161 5014 29030  5 95  0  0  0
125 19 8693816 327172   1020 558488  226    1   569   227 1991 13841  0 99  0  0  0
97 15 8703600 327044   1032 554792 5083 3217 10447  3722 26436 202860  1 99  0  0  0
102 20 8733556 327272   1432 556224 2573 6713  5399  7194 16118 66262  1 98  0  0  0
84  9 8732984 327164   1100 555640  470    2  1090   117 1585 11922  0 99  0  0  0
85 13 8732940 327304    880 554024   60    0   317    50 1470 11247  0 99  0  0  0
149 24 8732808 327428    988 553988  133    0   814   334 1962 12802  4 95  0  0  0
153 22 8732640 327284    592 553576  187    0   875   548 4619 36573  2 98  0  0  0
159 15 8732584 327104    604 552956   50    0    96   118 2294 11239  0 99  0  0  0
142 14 8732432 328644   1524 554196  174    0  1706   260 6035 45843  0 99  0  0  0
158 12 8755436 327460   2704 555568 1130 4927  2564  5486 14539 103001  0 99  0  0  0
125 14 8754920 327980    748 554368  406    0   662     6 1583 10952  0 100  0  0  0
115 16 8752204 327472   1724 553740 2453    5  6014   532 11366 82957  1 99  0  0  0
124 19 8752276 327076   1092 554200   78   28   113    81 1767 11712  1 99  0  0  0
82  8 8757568 346356   2384 556132 1316 3202  4373  3837 6633 42986  1 99  0  0  0
151 57 8756348 329524   3632 559164  828    0  3718   429 2076 11613  3 96  0  0  0
159 49 8755120 328488   3248 557720 1033    9  4298   212 2248 12981  4 95  0  0  0
107 36 8771748 332068   1016 557272 2765 3977  9481  4370 14773 103588  2 98  0  0  0
117 16 8771592 327180   1168 558788  156    0   979    58 1466 9988  1 99  0  0  0
 3 101 7875688 1448712   5300 599300 29898 73754 52723 83528 62497 360936  2 94  0  4  0
 3 96 7874004 1260800   8856 624552 7470    0 14911   569 3814 17649  5  1 33 61  0
 1 92 7859256 558968  11228 649948 5590    0 11118  2798 10027 41964 20  5 12 63  0
 0 96 7915604 327600  14060 652636 4674 11822  7818 12173 9053 22067  8  7 20 65  0
 8 98 7963060 327240  11800 635164 1994 11097  3294 12031 6762 16549  3  7  1 90  0
 1 104 7969976 340320   8812 579564 9600 1558 12002  2998 8588 22984 17 34 10 39  0
 4 89 7642788 666372  10244 603740 7154    0 12148  2375 9681 23420  7  5 22 67  0
 1 94 7642548 327912  12556 625672 7011    3 12173  1704 7865 21465  6  5 18 71  0
 7 95 7630564 327572   3396 557488 5970   33 10358  1827 4756 15284  5 67  3 25  0
113 45 7630124 330244   1900 545524 3819    5  7540  1314 3781 13454  2 88  0 10  0
 0 88 6897380 1321012   3560 573532 3635    1  9076  2802 3414 11193  3 64  7 26  0
 1 94 6889436 981560   6188 624532 8463    0 16870  4122 4949 17243  2  1 31 65  0
 0 79 6889308 890800   8444 666940 7332    0 13390  3077 3337 15930  5  1 33 60  0
 1 74 6878180 797212  10720 715612 6776    0 14430  4653 3424 13069 11  6 37 47  0
 0 141 6876812 406704  12856 739628 7202    0 11406  2342 4737 23064  6  5 24 64  0
 2 66 6874848 336480  13428 656312 6296    1 10126  1848 4375 16755  7  9 32 52  0
 2 69 6874192 338016   8288 577196 7297    0 14230  1208 5771 16410 10  5 38 47  0
 1 72 6873696 342908   3796 576568 6161    1 12562  1149 5506 13421 11  5 34 50  0
 2 78 6873524 336716   3992 589684 5718    0 12693   280 5268 11889  9  2 31 58  0
97 48 6873180 331280   2884 559732 5110    4  7616   934 6994 14502  7 38 12 43  0
120 41 6872636 327192   1504 549972 4309   32  7965  1497 7029 14159  5 92  0  3  0
101 26 6870204 327620   1992 548548 4122   19  8110  1191 9559 20993  4 96  0  0  0
82 16 6886048 327184    984 547140 2050 3186  3662  3385 4978 16982  2 98  0  0  0
83  6 6886384 327096   1376 545516  563   69  1284   184 1946 7812  1 99  0  0  0
93 11 6886364 328100    836 545120  798    0   911    18 5495 23655  0 100  0  0  0
27 42 7008372 328376   3216 550820 7050 26176  9220 26390 9919 42056  0 100  0  0  0
 3 112 7044188 328628   4552 554876 2424 8493  3526  8570 2402 7432  2 78  1 19  0
 3 113 7108916 348172   5532 560420 3186 14382  4325 14512 9715 15529  4  6  4 87  0
 0 125 7136504 366528   7040 567140 4077 10618  5413 10906 15231 26777  4  1 12 83  0
 1 111 7149172 387580   7320 568044  391 4344   719  4394 2460 7519  1  1  0 99  0
 1 94 7178000 328136   9984 580152 5768 7927  8617  8990 20026 30064  8  3  9 80  0
 0 86 7204696 327100  10268 583912 1972 6991  2825  7515 5943 12124  3  2  8 87  0
 0 103 7218656 347300  10564 585360  457 4985   733  5144 1936 8120  0  1  6 93  0
 5 98 7236196 345460  10784 585224 1298 5318  1467  5477 7973 13715  3  2  6 89  0
 1 111 7243488 328920  10932 586500  488 3097   839  3136 1843 7555  1  1  6 92  0
 0 103 7265100 328016  11132 591452 1439 6088  2170  6241 3984 9707  2  1  2 95  0
 2 91 7274576 335116  11272 591240  709 3526   789  3750 2162 7734  3  1  2 95  0
 1 124 7303804 329200  11408 593516 1170 7348  1587  7614 4230 9955  3  1  6 90  0
 4 61 7403224 343940  11724 601684 3143 20878  4191 22518 7000 14053  4  4  3 89  0
11 62 7589208 349448  12504 607764 4350 38374  5784 38847 13038 21696  6  6  9 79  0
 3 56 7777608 338348  13328 614952 6506 38412  7919 38711 11993 18575  6  6 16 71  0
 2 49 8025300 331604  13568 618408 5642 50410  6727 50490 14740 19779  7  7 35 51  0
 1 69 8159548 977560  14304 624024 4725 27423  6727 28257 13122 22037 10  7 12 72  0
 5 50 8159156 869324  18188 647964 9421    0 13542  1034 14117 30070 16  4 24 55  0
 2 46 8158644 768600  20324 663440 10323    0 13395  2023 18356 27259 15  3 52 30  0
 3 43 8158308 551160  22344 678548 12241    0 16135   623 14080 23349 19  3 42 36  0
We got this message in the alert log:
Mon Sep 01 11:09:28 2014
 GES: System Load is HIGH.
 GES: Current load is 204.89 and high load threshold is 80.00
After this the instance crashed:
Instance terminated by LMS0, pid = 4532
Bug 17316830, “ROOT CAUSE ALL DATABASE INSTANCES CRASHED ON ONE OF OUR NODES”, relates high paging and low free memory to the same GES load messages and to instances crashing as ours did. So, it seems that when you have a lot of paging it can cause an instance to crash. Is this a bug or a feature? 🙂
It was interesting to look at the OS Watcher files to see information about the nature of the system when our issues occurred. Looks like lots of paging. The only question is what caused the paging? We are trying to figure out if we just had some abnormally high memory use from our application or if some bug caused some system processes to eat up the normally free memory. But, I thought I would share the investigation we did using the OS Watcher logs because it was interesting to see an example with paging, even though we have not gotten to the root of the problem.
– Bobby