I read all the Arthur Conan Doyle Sherlock Holmes stories and have recently watched a couple Star Trek The Next Generation stories with the android Data pretending to be Holmes and it gave me the idea for this post about diagnosing an Oracle hang/bug that has been giving me fits lately. The logic involved in solving my Oracle problem reminds me of this often-quoted Sherlock Holmes saying:
“…when you have eliminated the impossible, whatever remains, however improbable, must be the truth…”
Sherlock Holmes
I have often had moments in diagnosing Oracle problems that resemble the idea behind this quote. I think this happens when the information I have in front of me does not directly lead to a solution. Most of the time it does. You get an error, you look it up, and you fix the problem. But sometimes things do not make sense. It looks like the database or hardware is not working correctly even though it is. Somehow, I have to discipline my mind to believe that the system is working correctly and follow the logical conclusions. Well, maybe I should talk about my example and it will be clearer.
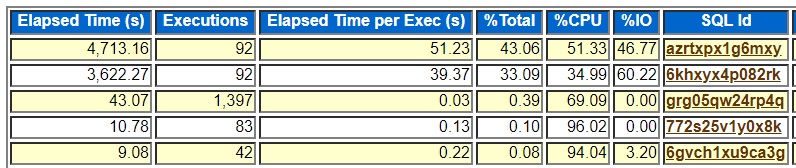
I spent a week moving my daughter into her college dorm and then visiting my parents in Alabama. It was a lot of travel along with the COVID-19 fears although it all went well. (I wore my mask everywhere). But then I got back in the office (online from home) and found that the project I was working on had a batch job hung up. I was also on call last week, so it was a little stressful. The hung session was a query coordinator process for a parallel INSERT statement, and it was hung on an PX Deq: Join ACK wait. It was hung for several days until we killed it, so it wasn’t just slow. We had already tested this job and every other batch job with no problems. Most were running significantly faster on our newer, faster x86-64 processors. But we were doing a final batch schedule test that runs several jobs at the same time trying to mimic production. No problem I thought. I will just head to Oracle’s support site and look up the wait event and see what to do. But my search turned up empty. If I was on 10.2 or some old version of RAC maybe, but nothing for 19c non-RAC. I tried Google too but nothing. Hmm. So, I opened an SR with Oracle. I made sure to get a statedump and hanganalyze while the session was still hung up. I figured no problem. Oracle will peek at the dumps and give me a patch and we will be on our way. But no deal. Oracle support was helpful, and I was getting them the information they asked for but nothing just jumped out at us. Plus, I was doing my own investigation looking at logs, trace files, and DBA_HIST views, etc. I was getting frustrated. This upgrade is supposed to go live soon and now all of a sudden at the last minute I am getting this weird wait event that no one seems to have heard of even though we have tested on this system for months with nothing like this.
I think this is where the Sherlock Holmes logic of deduction applies. Underlying my frustration is an assumption about reality. My assumption is that this horrible unknown wait is showing up in the same conditions that all our successful testing was in. The idea that the current testing is in a radically different configuration is the “possible but improbable” category. In this case we have two database VMs setup with the same number of cores and RAM and the same version of Oracle including patches and close to the same data, etc. We have a new production database and a performance database with the idea that development could do their final testing in a performance database that matches production. As it turns out all the init.ora parameters on the two databases are the same except for the ones that size the SGA and PGA memory. We are moving from an HP Unix system with a lot more physical memory than we have on these VMs so the SGA_TARGET and PGA_TARGET settings on that system together exceed the memory available on the new VMs but we copied the parameters from the HP system to the new Linux ones. Evidently, I correctly resized these down on the production system but never on the performance system. So, somewhere in our full-scale batch testing with a bunch of parallel SQL statements overloading the system and a ton of swapping of memory caused by the wrong parameters some parallel server process died leaving my query coordinator hung on PX Deq: Join ACK. I do not really know if this is true. But it fits the facts. I synced these memory parameters up with the working production database, we reran the problem job, and it ran like clockwork. It really helps to have free memory.
In some ways my example is simple. You cannot set SGA_TARGET and PGA_TARGET to more than your total memory and expect good things to happen. DBA 101. But the more interesting thing, at least to me, is the mindset that I need to have when facing a difficult Oracle problem. Here are some of the truths in my mind during this problem:
- Our new production database works great and testing has gone very well for months
- Our new performance database is very similar to our new production database
- Our batch jobs ran fast and error free individually in production
- Run together on perf our batch jobs hung up with a weird wait
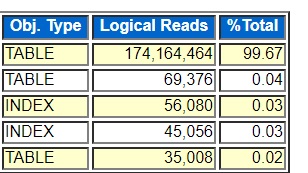
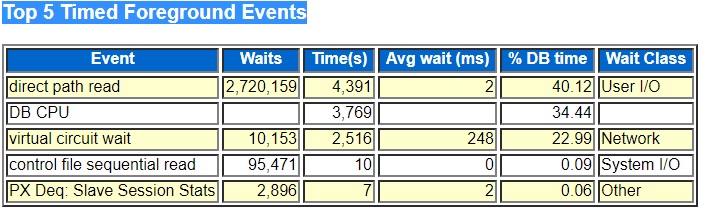
- Lots of things I looked at including AWR reports, alert logs, etc. looked weird
I guess I would like my brain to more quickly jump to questioning my assumption that the performance database is like production. Sure, running a bunch of batch jobs at the same time will put more load on the system and may create problems. But suddenly hitting some weird bug that no one in the world has ever hit doesn’t really make sense. There must be some reasonable explanation that makes sense without assuming some terrible thing is wrong with our database despite months of success using this version of Oracle on this data and code. Other people would be reporting the same thing and blogging about it.
I am not sure how clear this is. I have something I am trying to say about logic and problem solving with Oracle databases but do not know if I have said it in a coherent way. A working database and hardware do not suddenly start doing weird things for no reason. After eliminating that virtual impossibility, you are left with possible solutions that you have not considered because they seem so unlikely. Elementary…
Bobby
P.S. I have a feeling that people are not that interested in this post which is fine. It does not have any useful scripts in it. But, I ran into another situation today that fits the same theme.
Here are the facts:
- Import and index build of large schema takes longer than on earlier runs
- Linux admin says there is a lot of I/O on the redo logs
- Storage admin says there was a bump in service times despite being on a nice array and SSD
- Import uses data pump and indexes built parallel nologging
- We have been experimenting with GGS on this system
- We are importing more data than in previous run
I guess eliminating the impossible means eliminating the idea that heavy redo log I/O is not occurring. It was occurring no matter how much that conflicts with my model of reality. The improbable is that my parallel nologging index build and data pump are somehow doing a boatload of log I/O. Enter the solution. Somehow this database got set to force logging, probably during our work with GGS. It didn’t take me that long to figure it out today but I could have put the redo log I/O into my thoughts earlier. Anyway, I am having fun with this post and maybe it is not so helpful. Sherlock Holmes is not the sum of all knowledge. But there is something to be said for taking the evidence where it leads even if it is not where you expect.