Default degree may cause performance problems

I encourage people that I work with to put a small number like 8 as the parallel degree when they want to create tables or indexes to use parallel query.  For example:

SQL> create table test parallel 8 as select * from dba_tables;

Table created.

SQL> 
SQL> select degree from user_tables where table_name='TEST';

DEGREE
----------
         8

But frequently I find tables that were created with the default degree by leaving out a number on the parallel clause:

SQL> create table test parallel as select * from dba_tables;

Table created.

SQL> 
SQL> select degree from user_tables where table_name='TEST';

DEGREE
----------
   DEFAULT

The problem is that on a large RAC system with a lot of CPUs per node the default degree can be a large number.  A table with a large degree can cause a single query to eat up all of the available parallel query processes.  That’s fine if only one query needs to run at a time but if you plan to run multiple queries in parallel you need to divide up the parallel query processes among them.  I.e. if you have 100 parallel query processes and need to run 10 queries at a time then you need to be sure each query only gets 10 of them.  I guess degree=5 is 10 processes but the point is that you don’t want to start running a bunch of queries with a degree of 50 each when you have 100 parallel processes to divide up.

With the default settings default degree is 2 X number of cpus X number of RAC nodes.  I tested this on an Exadata V2 with 2 nodes and 16 cpus per node.  The result was as expected, degree=64:

Final cost for query block SEL$1 (#0) - All Rows Plan:
  Best join order: 1
  Cost: 2.1370  Degree: 64  Card: 4203.0000  Bytes: 54639
  Resc: 123.0910  Resc_io: 123.0000  Resc_cpu: 2311650
  Resp: 2.1370  Resp_io: 2.1354  Resc_cpu: 40133

Just to verify that a query with parallel 8 would really use degree 8 I ran the same test with the same table but parallel 8:

Final cost for query block SEL$1 (#0) - All Rows Plan:
  Best join order: 1
  Cost: 6.5419  Degree: 8  Card: 4715.0000  Bytes: 61295
  Resc: 47.1020  Resc_io: 47.0000  Resc_cpu: 2593250
  Resp: 6.5419  Resp_io: 6.5278  Resc_cpu: 360174

Also note the lower cost(2) in the plan with default degree:

--------------------------------------------------+-----------------------------------+-------------------------+
| Id  | Operation                       | Name    | Rows  | Bytes | Cost  | Time      |  TQ  |IN-OUT|PQ Distrib |
--------------------------------------------------+-----------------------------------+-------------------------+
| 0   | SELECT STATEMENT                |         |       |       |     2 |           |      |      |           |
| 1   |  SORT AGGREGATE                 |         |     1 |    13 |       |           |      |      |           |
| 2   |   PX COORDINATOR                |         |       |       |       |           |      |      |           |
| 3   |    PX SEND QC (RANDOM)          | :TQ10000|     1 |    13 |       |           |:Q1000| P->S |QC (RANDOM)|
| 4   |     SORT AGGREGATE              |         |     1 |    13 |       |           |:Q1000| PCWP |           |
| 5   |      PX BLOCK ITERATOR          |         |  4203 |   53K |     2 |  00:00:01 |:Q1000| PCWC |           |
| 6   |       TABLE ACCESS STORAGE FULL | TEST    |  4203 |   53K |     2 |  00:00:01 |:Q1000| PCWP |           |
--------------------------------------------------+-----------------------------------+-------------------------+

Compared to degree 8 (cost=7):

--------------------------------------------------+-----------------------------------+-------------------------+
| Id  | Operation                       | Name    | Rows  | Bytes | Cost  | Time      |  TQ  |IN-OUT|PQ Distrib |
--------------------------------------------------+-----------------------------------+-------------------------+
| 0   | SELECT STATEMENT                |         |       |       |     7 |           |      |      |           |
| 1   |  SORT AGGREGATE                 |         |     1 |    13 |       |           |      |      |           |
| 2   |   PX COORDINATOR                |         |       |       |       |           |      |      |           |
| 3   |    PX SEND QC (RANDOM)          | :TQ10000|     1 |    13 |       |           |:Q1000| P->S |QC (RANDOM)|
| 4   |     SORT AGGREGATE              |         |     1 |    13 |       |           |:Q1000| PCWP |           |
| 5   |      PX BLOCK ITERATOR          |         |  4715 |   60K |     7 |  00:00:01 |:Q1000| PCWC |           |
| 6   |       TABLE ACCESS STORAGE FULL | TEST    |  4715 |   60K |     7 |  00:00:01 |:Q1000| PCWP |           |
--------------------------------------------------+-----------------------------------+-------------------------+

So, this shows that in this case with 2 node RAC and 16 cpus per node that the optimizer uses degree 64 for default degree and is more likely to choose a full scan over an index scan because the cost of the degree 64 full scan is less than that of a degree 8 full scan.

The key point is to understand that putting the keyword PARALLEL by itself on a table or index creation statement instead of PARALLEL 8 (or 4 or 16) can result in unexpectedly high degree.  This high degree can cause performance to degrade by allowing individual queries to eat up the parallel query processes leaving other queries to run inefficiently without the expected parallelism.  The high degree also reduces the cost of a full scan potentially causing them to be favored over index scans where the index scan would be more efficient.

– Bobby

p.s. Here is a zip of the scripts and logs that I used to create the 10053 traces: zip

Posted in Uncategorized | 2 Comments

How to find queries that use subpartition statistics

Yesterday I was trying to figure out if any queries on a particular production database were using subpartition statistics on a certain table.  We are having trouble getting the statistics gathering job to finish gathering stats on all the subpartitions of this table in the window of time we have given the stats job.  My thought was that we may not even need stats on the subpartitions, so I wanted to find queries that would prove me wrong.

My understanding of Oracle optimizer statistics is that there are three levels – table or global, partition, and subpartition.  The table I am working on is partitioned by range and subpartitioned by list.  So, I think that the levels are used in these conditions:

  1. Global or table: Range that crosses partition boundaries
  2. Partition: Range is within one partition but specifies more than one list value
  3. Subpartition: Range is within one partition and specifies one list value

In the table I was working on it was partitioned by week and subpartitioned by location so a query that specified a particular week and an individual location should use the subpartition stats.

So, I did some experimentation and came up with this query:

select
p.PLAN_HASH_VALUE,
min(p.sql_id),
count(*)
from 
DBA_HIST_SQL_PLAN p
where 
p.OBJECT_OWNER='MYOWNER' and
p.OBJECT_NAME='MYTABLE' and
p.partition_start=p.partition_stop and
substr(p.partition_start,1,1) 
in ('0','1','2','3','4','5','6','7','8','9') and
p.sql_id in (select sql_id from DBA_HIST_SQLSTAT)
group by p.PLAN_HASH_VALUE
order by p.PLAN_HASH_VALUE;

I’ve replaced the real owner and table name with MYOWNER and MYTABLE.  The point of this query is to find the distinct plans that use subpartition statistics and one sql query as an example of each plan.  There were multiple queries with the same plans but slightly different constants in their where clause so I just needed one example of each.

In my experimentation I found that plans that had the same numbers for the partition stop and start were the plans that used subpartition stats.  I’m not sure about the plans that don’t have numbers in their partition start and stop columns.

Here is what the output looks like:

PLAN_HASH_VALUE MIN(P.SQL_ID)   COUNT(*)
--------------- ------------- ----------
      151462653 fugdxj00cnwxt          1
      488358452 21kr79rst8663          2
      634063666 5fp4rnzgw6gvc          1
     1266515004 98zbx8gw95zf8          2
     1397966543 37gaxy58sr1np          2
     1468891601 5fp4rnzgw6gvc          1
     1681407819 001aysuwx1ba4        230
     1736890182 64tmnnap05m6b          2
     2242394890 2tp8jx3un534j          1
     2243586448 9fcd80ms6h7j4          2
     2418902214 64tmnnap05m6b          1
     2464907982 5fp4rnzgw6gvc          1
     3840767159 05u7fy79g0jgr        143
     4097240051 5mjgz2v8a3p6h          1

This is the output on our real system.  Once I got this list I built a script to dump out all of these plans and the one sql_id for each:

select * from table(DBMS_XPLAN.DISPLAY_AWR('fugdxj00cnwxt',151462653,NULL,'ALL'));
select * from table(DBMS_XPLAN.DISPLAY_AWR('21kr79rst8663',488358452,NULL,'ALL'));
select * from table(DBMS_XPLAN.DISPLAY_AWR('5fp4rnzgw6gvc',634063666,NULL,'ALL'));
select * from table(DBMS_XPLAN.DISPLAY_AWR('98zbx8gw95zf8',1266515004,NULL,'ALL'));
select * from table(DBMS_XPLAN.DISPLAY_AWR('37gaxy58sr1np',1397966543,NULL,'ALL'));
select * from table(DBMS_XPLAN.DISPLAY_AWR('5fp4rnzgw6gvc',1468891601,NULL,'ALL'));
select * from table(DBMS_XPLAN.DISPLAY_AWR('001aysuwx1ba4',1681407819,NULL,'ALL'));
select * from table(DBMS_XPLAN.DISPLAY_AWR('64tmnnap05m6b',1736890182,NULL,'ALL'));
select * from table(DBMS_XPLAN.DISPLAY_AWR('2tp8jx3un534j',2242394890,NULL,'ALL'));
select * from table(DBMS_XPLAN.DISPLAY_AWR('9fcd80ms6h7j4',2243586448,NULL,'ALL'));
select * from table(DBMS_XPLAN.DISPLAY_AWR('64tmnnap05m6b',2418902214,NULL,'ALL'));
select * from table(DBMS_XPLAN.DISPLAY_AWR('5fp4rnzgw6gvc',2464907982,NULL,'ALL'));
select * from table(DBMS_XPLAN.DISPLAY_AWR('05u7fy79g0jgr',3840767159,NULL,'ALL'));
select * from table(DBMS_XPLAN.DISPLAY_AWR('5mjgz2v8a3p6h',4097240051,NULL,'ALL'));

Here is a edited down output of just the relevant part of the first plan:

Plan hash value: 151462653

------------------------------------------------------------------
| Id  | Operation                 | Name         | Pstart| Pstop |
------------------------------------------------------------------
|  31 | TABLE ACCESS STORAGE FULL | MYTABLE      | 41017 | 41017 |
------------------------------------------------------------------

This query had conditions in its where clause like this:

LIST_COLUMN = 1234 AND
(RANGE_COLUMN BETWEEN
TO_DATE('20130609000000','YYYYMMDDHH24MISS') AND
TO_DATE('20130615000000','YYYYMMDDHH24MISS'))

I’ve renamed the real column for the list subpartioning to LIST_COLUMN and renamed the real column for the range partitioning to RANGE_COLUMN.

One interesting thing I realized was that since we are on an Exadata system and there are no visible indexes on the subpartitioned table the subpartition stats aren’t being used to determine whether the query will use an index scan or full scan.  But, they are used in these queries to determine the number of rows the full scan will return so that could impact the plan.

I’m thinking of using table preferences to just turn off the subpartition stats gathering using a call like this:

begin

DBMS_STATS.SET_TABLE_PREFS ('MYOWNER','MYTABLE',
    pname=>'GRANULARITY',
    pvalue=>'GLOBAL AND PARTITION');

end;
/

As it is the table has 40,000 subpartitions and the daily stats job isn’t finishing anyway so regardless of the queries that use the subpartition stats I think we should set the preference.  Maybe just leave dynamic sampling to handle the queries that actually use the one subpartition’s stats or have some application job gather stats on the one subpartition when it is initially loaded.  It is a work in progress, but I thought I would share what I’ve been doing.

– Bobby

Posted in Uncategorized | Leave a comment

CPU Queue Time as SQL*Net wait

I was testing a script that did a lot of very short SQL statements and running many of them at the same time to bog down the CPU on the database server.  I kept seeing high “SQL*Net message from client” waits from my profiling SQL code.

Normally a profile of a single long running statement when there is a large CPU queue looks like this:

SUBSTR(TIMESOURCE,1,30)           SECONDS PERCENTAGE
------------------------------ ---------- ----------
TOTAL_TIME                             74        100
UNACCOUNTED_TIME                       37         50
CPU                                    37         50

This is a one CPU VM with two 100% CPU queries.  Each one’s CPU accounts for half of the total elapsed time leaving the other half unaccounted for.

But, take a high CPU load system and run a bunch of short sql statements the profile looks like this:

SUBSTR(TIMESOURCE,1,30)           SECONDS PERCENTAGE
------------------------------ ---------- ----------
TOTAL_TIME                             13        100
SQL*Net message from client             8         62
log file sync                           5         38
CPU                                     1          8

This is a script with a bunch of insert/commit combinations like this:

insert into testtable values (1);
commit;
insert into testtable values (1);
commit;
insert into testtable values (1);
commit;
insert into testtable values (1);
commit;
insert into testtable values (1);
commit;
insert into testtable values (1);
commit;
insert into testtable values (1);
commit;
insert into testtable values (1);
commit;

Without the high CPU load the profile is like this:

SUBSTR(TIMESOURCE,1,30)           SECONDS PERCENTAGE
------------------------------ ---------- ----------
TOTAL_TIME                              3        100
SQL*Net message from client             1         33
CPU                                     1         33
log file sync                           1         33

It looks like the SQL*Net message from client and log file sync times were both inflated by the high CPU load in the previous profile.

I tried this for shared and dedicated servers and for some reason shared servers reports even more SQL*Net waits for the same CPU load:

SUBSTR(TIMESOURCE,1,30)           SECONDS PERCENTAGE
------------------------------ ---------- ----------
TOTAL_TIME                             20        100
SQL*Net message from client            14         70
log file sync                           6         30
CPU                                     1          5

In further testing I was getting twice as many SQL*Net message from client waits for the same script with shared servers compared to dedicated so maybe that is why shared server connections are more sensitive to high CPU loads and report higher SQL*Net message from client waits.

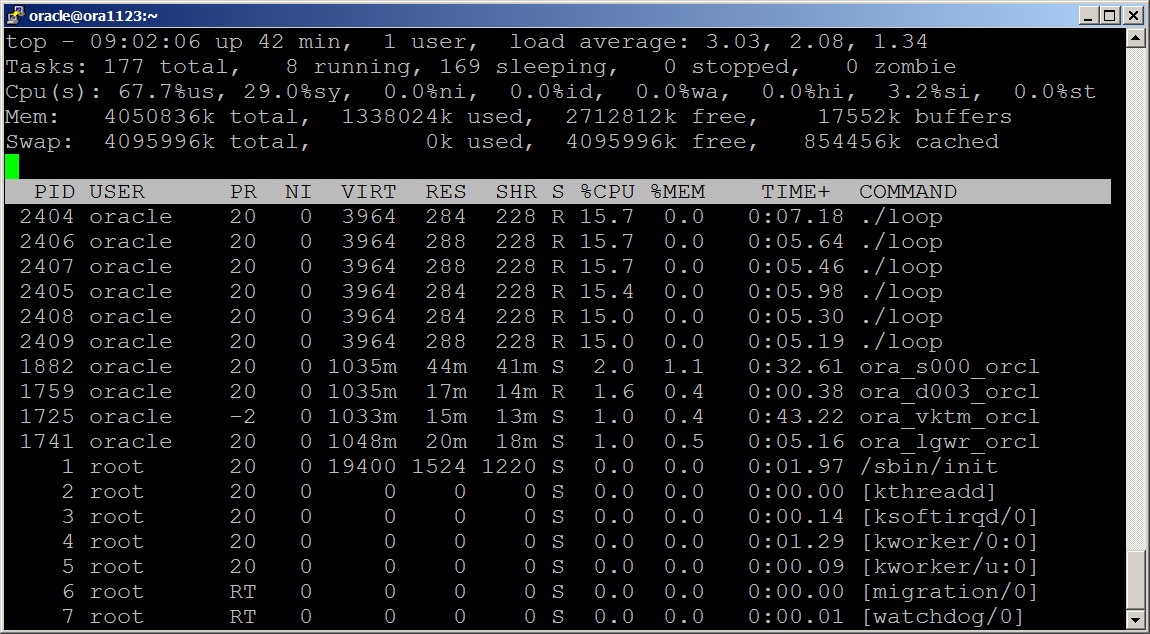
Here is what the CPU looked like for the shared server example:

top-c

Notice the six loops – a simple C program with infinite loop.  These should be starving the other oracle processes for the CPU.  Note that this is the “c” option of top which is really helpful because it shows you the oracle process names like ora_lgwr_orcl similar to the default display on HP-UX’s glance tool.

So, I guess I was surprised that SQL*Net message from client waits were inflated by queuing on the CPU but it looks like they are.  This appears to be most visible when you have a lot of short run time SQL statements.

– Bobby


Posted in Uncategorized | 2 Comments

Session profile using V$ tables

Hopefully this is not too redundant to previous posts but I’ve found that I keep using a particular script to debug performance issues and I thought I’d share it and explain what I use it for.  It’s helpful to me so I’m sure someone could use it unless they have their own tools which meet the same needs.

The first usergroup presentation I did was on the topic of profiles and was based on things I had learned a variety of places including Jeff Holt and Cary Millsap’s excellent book titled “Optimizing Oracle Performance”.

Out of all that came a simple set of SQL and sqlplus commands that I tag on to the end of a sqlplus script that I want to get a profile of.  In my case a profile includes:

  • Real Elapsed time
  • CPU
  • Waits

The main point of my paper and the critical point I got from the Holt and Millsap book and other things was to compare the total waits and CPU to the real time.  So, this SQL/sqlplus code is a quick and dirty way to get this kind of profile for a sqlplus script that you are running as part of a performance testing exercise.  Here is the code:

VARIABLE monitored_sid number;

begin

SELECT sid into :monitored_sid from v$session 
where audsid=USERENV('SESSIONID');

end;
/

SELECT SID, substr(USERNAME,1,12) Username, 
substr(TIMESOURCE,1,30), SECONDS, 
ROUND(SECONDS/(SELECT ROUND((SYSDATE-LOGON_TIME)*24*60*60,0) 
FROM V$SESSION WHERE SID= :monitored_sid),2)*100 
AS PERCENTAGE
FROM
(SELECT logon_time, SID, username, 'TOTAL_TIME' TIMESOURCE,
ROUND((SYSDATE-LOGON_TIME)*24*60*60,0) SECONDS
FROM V$SESSION 
WHERE SID= :monitored_sid
UNION ALL
SELECT a.logon_time, a.SID,a.USERNAME,'CPU' TIMESOURCE,
ROUND((VALUE/100),0) SECONDS
FROM V$SESSION a, V$SESSTAT b
where a.SID = b.SID
and a.SID = :monitored_sid
and b.STATISTIC# = (SELECT STATISTIC# FROM V$STATNAME 
WHERE NAME='CPU used by this session')
UNION ALL
SELECT b.logon_time, a.SID,b.USERNAME,a.EVENT TIMESOURCE,
ROUND((TIME_WAITED/100),0) SECONDS
FROM V$SESSION_EVENT a, V$SESSION b
WHERE a.SID = b.SID
AND a.SID= :monitored_sid
UNION ALL
select b.logon_time, a.sid, b.username, 
'UNACCOUNTED_TIME' TIMESOURCE,
ROUND(MAX(SYSDATE-LOGON_TIME)*24*60*60,0)-
(ROUND(SUM((TIME_WAITED/100)),0)+ROUND(MAX(VALUE/100),0)) 
as UNACCOUNTED_FOR_TIME
FROM V$SESSION_EVENT a, V$SESSION b, V$SESSTAT c
WHERE a.SID = b.SID
AND b.sid = c.sid
and c.STATISTIC# = (SELECT STATISTIC# FROM V$STATNAME 
WHERE NAME='CPU used by this session')
AND a.SID= :monitored_sid
group by b.logon_time, a.sid, b.username)
order by SECONDS desc;

And here is some typical output:

SUBSTR(TIMESOURCE,1,30)           SECONDS PERCENTAGE
------------------------------ ---------- ----------
TOTAL_TIME                             43        100
direct path read                       30         70
CPU                                     5         12
db file scattered read                  4          9
db file sequential read                 4          9
Disk file operations I/O                0          0
SQL*Net message to client               0          0
SQL*Net message from client             0          0
events in waitclass Other               0          0
enq: KO - fast object checkpoi          0          0
UNACCOUNTED_TIME                       -1         -2

I left off the initial SID and username columns so the output would fit on this page, but if you run it you get that information as well.  The output contains waits and CPU which I think are typical but the two values TOTAL_TIME and UNACCOUNTED_TIME may be unusual.

TOTAL_TIME is the real elapsed time since the user first logged in to this session.

UNACCOUNTED_TIME is TOTAL_TIME-sum of the waits and CPU.  If there is a lot of queuing for the CPU then UNACCOUNTED_TIME goes up.

Here is a zip of an example of the use of this code in a script.

The idea is that you run the script like this:

username/password@dbname < profileexample.sql

If you want to learn how to use this kind of profile I would encourage you to read the paper, but the short answer is to just look at which is the biggest consumer of time – CPU, a particular wait, or something unknown, and let that lead the next steps of your investigation.

– Bobby

Posted in Uncategorized | Leave a comment

Same plan hash value different partition range

Today I saw two different plans with the same plan hash value but different numbers of partitions.  So, the partition numbers must not factor into the plan hash value.  So, you can’t count on the plan hash value to fully indicate whether two plans are the same.

I’ve taken the real plans and just modified the table and index names so I won’t expose our real names.  But, otherwise this is the real thing:

10/30/2013 plan

Plan hash value: 11498413

----------------------------------------------------------------------------------------------------------------------------------------------------------
| Id  | Operation                               | Name              | Rows  | Bytes | Cost (%CPU)| Time     | Pstart| Pstop |    TQ  |IN-OUT| PQ Distrib |
----------------------------------------------------------------------------------------------------------------------------------------------------------
|   0 | MERGE STATEMENT                         |                   |       |       |  4440 (100)|          |       |       |        |      |            |
|   1 |  MERGE                                  | TABLE_ONE         |       |       |            |          |       |       |        |      |            |
|   2 |   PX COORDINATOR                        |                   |       |       |            |          |       |       |        |      |            |
|   3 |    PX SEND QC (RANDOM)                  | :TQ10000          | 21446 |    45M|  4440   (1)| 00:01:03 |       |       |  Q1,00 | P->S | QC (RAND)  |
|   4 |     VIEW                                |                   |       |       |            |          |       |       |  Q1,00 | PCWP |            |
|   5 |      NESTED LOOPS OUTER                 |                   | 21446 |    45M|  4440   (1)| 00:01:03 |       |       |  Q1,00 | PCWP |            |
|   6 |       PX PARTITION RANGE ALL            |                   | 21446 |    22M|  1459   (1)| 00:00:21 |     1 |   156 |  Q1,00 | PCWC |            |
|   7 |        TABLE ACCESS BY LOCAL INDEX ROWID| TABLE_TWO         | 21446 |    22M|  1459   (1)| 00:00:21 |     1 |   156 |  Q1,00 | PCWP |            |
|   8 |         INDEX RANGE SCAN                | INDEX_TABLE_TWO   | 21593 |       |    26   (0)| 00:00:01 |     1 |   156 |  Q1,00 | PCWP |            |
|   9 |       TABLE ACCESS BY GLOBAL INDEX ROWID| TABLE_ONE         |     1 |  1145 |     0   (0)|          | ROWID | ROWID |  Q1,00 | PCWP |            |
|  10 |        INDEX UNIQUE SCAN                | PK_TABLE_ONE      |     1 |       |     0   (0)|          |       |       |  Q1,00 | PCWP |            |
----------------------------------------------------------------------------------------------------------------------------------------------------------

11/11/2013 plan

Plan hash value: 11498413

----------------------------------------------------------------------------------------------------------------------------------------------------------
| Id  | Operation                               | Name              | Rows  | Bytes | Cost (%CPU)| Time     | Pstart| Pstop |    TQ  |IN-OUT| PQ Distrib |
----------------------------------------------------------------------------------------------------------------------------------------------------------
|   0 | MERGE STATEMENT                         |                   |       |       |  4845 (100)|          |       |       |        |      |            |
|   1 |  MERGE                                  | TABLE_ONE         |       |       |            |          |       |       |        |      |            |
|   2 |   PX COORDINATOR                        |                   |       |       |            |          |       |       |        |      |            |
|   3 |    PX SEND QC (RANDOM)                  | :TQ10000          | 21966 |    46M|  4845   (1)| 00:01:08 |       |       |  Q1,00 | P->S | QC (RAND)  |
|   4 |     VIEW                                |                   |       |       |            |          |       |       |  Q1,00 | PCWP |            |
|   5 |      NESTED LOOPS OUTER                 |                   | 21966 |    46M|  4845   (1)| 00:01:08 |       |       |  Q1,00 | PCWP |            |
|   6 |       PX PARTITION RANGE ALL            |                   | 21966 |    22M|  1469   (1)| 00:00:21 |     1 |   208 |  Q1,00 | PCWC |            |
|   7 |        TABLE ACCESS BY LOCAL INDEX ROWID| TABLE_TWO         | 21966 |    22M|  1469   (1)| 00:00:21 |     1 |   208 |  Q1,00 | PCWP |            |
|   8 |         INDEX RANGE SCAN                | INDEX_TABLE_TWO   | 22638 |       |    33   (0)| 00:00:01 |     1 |   208 |  Q1,00 | PCWP |            |
|   9 |       TABLE ACCESS BY GLOBAL INDEX ROWID| TABLE_ONE         |     1 |  1151 |     0   (0)|          | ROWID | ROWID |  Q1,00 | PCWP |            |
|  10 |        INDEX UNIQUE SCAN                | PK_TABLE_ONE      |     1 |       |     0   (0)|          |       |       |  Q1,00 | PCWP |            |
----------------------------------------------------------------------------------------------------------------------------------------------------------

One of these queries was run on 10/30/2013 (the one with fewer partitions).  The other was run yesterday and is still running.  Looks like the range scan has a bunch more partitions worth of data today and that is why the query, despite the same plan hash value, is running longer.

The Pstop column has the high partition number so it looks like we had 156 partitions on 10/30 and 208 yesterday unless I’m missing something.

– Bobby

Posted in Uncategorized | 5 Comments

Nethack install on Oracle Enterprise Linux 32 bit

So,  I play one computer game – Nethack.  I have a page on the blog if you want some information about it.  I just finished building a 32 bit Linux virtual machine running on VMware player for the purpose of compiling Nethack.  I used the latest version of Oracle Enterprise Linux and configured it as a software development workstation.

I did this because I wanted to be able to putty into the VM and have the screen look the same as it does when I putty into nethack.alt.org.  I got my putty settings working well now with I think IBM graphics for the symbols.  But, it is helpful to compile your own copy of the game when you want to figure out how something works.  Plus it is fun to dork around with C code every once and a while since my normal job hardly ever requires it.

I used to use Cygwin to compile my own copy and ran it on a CRT monitor on Windows XP as a DOS window.  This was the most like the character based terminals that nethack originally ran on when I played it in college.  But, now I have a nice 22 inch flat screen monitor at home and I’ve upgraded to Windows 7 which doesn’t have the DOS window anymore.  So, I’ve moved to putty as my method of choice for playing Nethack.

I had downloaded the 64 bit version of OEL to use to install Oracle 12c and 11.2.0.3 in virtual machines that I could run from my new 64 bit OS laptop.  So, my first choice for a Nethack VM was a 64 bit Linux VM.  I was thinking I would use it for both playing with Nethack and other development type tasks where Linux was helpful.  But, I was getting grief from the 64 bit environment.  Evidently the Nethack code has some places that convert unsigned integers into pointers and vice-versa.  On 64-bit OEL these variables are different lengths.  So, after messing with this for longer than I intended – all I’m trying to do is get it where I can run the games from putty – I gave up on 64-bit Linux.

But, the question was, does Oracle still have 32-bit Linux because the new 12c download was only on 64-bit – at least the last time I checked.  Sure enough, Oracle still supports 32 bit Linux and so I downloaded that version and it worked pretty much the same as the 64 bit install except that the Nethack code compiled without all the pointer to integer conversion warnings.

So, I have a 32 bit Nethack VM and two 64 bit Oracle database VMs.  Fun!

– Bobby


Posted in Uncategorized | Leave a comment

More work on parse time bug

I wasn’t sure if people would find a post on a bug that interesting.  If you don’t have the same bug I’m not sure what you would get out of it.  But, it is what I’m working on.

Here are my earlier rants on the same problem: 9b4m3fr3vf9kn and an4593dzvqr4v, SQLT Data Explosion.

So, I worked with Oracle support and they became convinced we were hitting this base bug:

16864042: KKPOSAGEPROPSCBK() MAY CAUSE UNNECESSARY EXADATA PERFORMANCE REGRESSION

It made sense to me because this was the base bug for another bug:

Bug 16694856 : EXADATA: SUBPARTITION WITH ‘LIBRARY CACHE LOCK’ ON RAC + INDEX OPERATION

16694856 has similar symptoms to what we have in production namely a lot of 9b4m3fr3vf9kn and an4593dzvqr4v internal query executions.  Anyway, Oracle development looked at the information I uploaded and concluded we had indeed hit bug 16864042 and produced a back ported patch for our release which is great.

So, I’ve applied the patch on dev and qa but I can’t reproduce the problem anywhere but prod so I won’t really know if the patch helps until it goes all the way through.  I built this script as a test of the bug:

drop table executions_before;

create table executions_before as 
select sum(executions) before_executions from v$sql where
sql_id = 'an4593dzvqr4v';

explain plan for select count(*) from OURPROBLEMTABLE;

select after_executions-before_executions
from 
(select sum(executions) after_executions
from v$sql where
sql_id = 'an4593dzvqr4v'),executions_before;

On dev and qa before and after the patch it produces the same results.  It returns a value > 0 once and then afterwards looks like this every time it is run:

AFTER_EXECUTIONS-BEFORE_EXECUTIONS
----------------------------------
                                 0

But on prod every time it is run it returns a value > 0:

AFTER_EXECUTIONS-BEFORE_EXECUTIONS
----------------------------------
                              1224

So, I’m hoping that after I apply the patch prod will start behaving like dev and qa and it will start returning 0 after the first run like in dev and qa.  At least that would be a quick test of the prod patch once it is in.

Anyway, just thought I would share my pain.  Not sure what to get out of this except that you can’t always duplicate a bug you are seeing on prod on a dev/test system.

– Bobby

 
Posted in Uncategorized | Leave a comment

SQLT Emergency Plan Change

I’m on call this week so I didn’t plan to do any blog posting but I had an interesting performance issue this morning that I thought would be helpful to document.  This is somewhat redundant to earlier posts but maybe another real example would be helpful to others (and myself as I try to explain it).

So, I got paged at 5:16 AM today because the session count had gone up on a key database.  I connected using Toad and saw many active sessions.  A number were hung on row locks but others were running a normal query.  At first I thought the locks were the issue until I looked at the AWR report.

I executed DBMS_WORKLOAD_REPOSITORY.CREATE_SNAPSHOT, waited a couple of minutes, and then ran it again.  This gave me a short time period while the problem was occurring.  These were the top events:

Top 5 Timed Foreground Events

Event Waits Time(s) Avg wait (ms) % DB time Wait Class
enq: TX – row lock contention 11 517 47038 24.97 Application
db file scattered read 74,786 513 7 24.75 User I/O
db file sequential read 61,708 448 7 21.62 User I/O
DB CPU 431 20.82
read by other session 47,482 416 9 20.08 User I/O

So, this pointed to the locks, but then I looked at the top sql:

Elapsed Time (s) Executions Elapsed Time per Exec (s) %Total %CPU %IO SQL Id
1,447.68 106 13.66 69.86 25.24 73.68 b9ad7h2rvtxwf

This is a pretty normal query but there isn’t anything on our system that runs for more than a fraction of a second normally so a top query running for 13 seconds means there was a problem.

So, then I ran my sqlstat.sql(updated) script for the one query b9ad7h2rvtxwf.  Here were the results (edited to fit on the blog):

SQL_ID        PLAN_HASH_VALUE END_INTERVAL_TIME         EXECUTIONS_DELTA Elapsed Average ms CPU Average ms IO Average ms
------------- --------------- ------------------------- ---------------- ------------------ -------------- -------------
b9ad7h2rvtxwf      3569562598 22-OCT-13 04.00.09.971 PM             5058         147.520418     55.2906287    84.5061609
b9ad7h2rvtxwf      3569562598 22-OCT-13 05.00.29.056 PM             3553         138.164556     52.4176752    81.5798179
b9ad7h2rvtxwf      3569562598 22-OCT-13 06.00.48.108 PM             1744         131.999904     50.7224771    78.9727196
b9ad7h2rvtxwf      3569562598 22-OCT-13 07.00.07.435 PM             1151         129.623057     42.0590791    85.9294535
b9ad7h2rvtxwf      3569562598 22-OCT-13 08.00.28.121 PM              872         120.398335     36.7775229    83.2977339
b9ad7h2rvtxwf      3569562598 22-OCT-13 09.00.49.553 PM              604         132.635639     33.8245033    97.5104901
b9ad7h2rvtxwf      3569562598 22-OCT-13 10.00.09.004 PM              495         133.393253     33.1111111    99.2305293
b9ad7h2rvtxwf       405424828 22-OCT-13 11.00.29.567 PM              121         34966.0669     5395.86777    28047.5075
b9ad7h2rvtxwf      3569562598 22-OCT-13 11.00.29.567 PM              310         194.172239     34.7419355    159.561652
b9ad7h2rvtxwf       405424828 23-OCT-13 12.00.49.580 AM              367         13515.5776     4255.88556    9348.67928
b9ad7h2rvtxwf       405424828 23-OCT-13 01.00.08.933 AM              198         10156.8853     4131.56566    6100.66929
b9ad7h2rvtxwf       405424828 23-OCT-13 02.00.28.515 AM              121         13047.2503     4077.27273    9055.64753
b9ad7h2rvtxwf       405424828 23-OCT-13 03.00.48.829 AM              106         14410.4077     4095.75472    10457.2538
b9ad7h2rvtxwf       405424828 23-OCT-13 04.00.08.426 AM              132         13294.6225     3334.62121    10180.9116
b9ad7h2rvtxwf       405424828 23-OCT-13 05.00.29.523 AM              408         13075.3841     3327.35294    9828.64507
b9ad7h2rvtxwf       405424828 23-OCT-13 06.00.51.458 AM             1321         13314.1561     3119.74262    10091.0076
b9ad7h2rvtxwf       405424828 23-OCT-13 07.00.13.248 AM             3023         15692.5471     3126.99636     12361.605
b9ad7h2rvtxwf       405424828 23-OCT-13 07.39.33.767 AM             1924         16933.1762     3159.12682      13704.74
b9ad7h2rvtxwf       405424828 23-OCT-13 07.41.17.993 AM              106         13657.3272     3446.88679    10062.0426

So, between 10 and 11 pm last night the new plan 405424828 started being used and it resulted in the query that normally runs for 133 milliseconds (.1 seconds) running instead for 10091 ms = 10 seconds.  Not good when the query is run over 1000 times per hour.

So, I copied the sqlt scripts from another database server and got into the utl directory and ran the following commands:

-- build script to load profile

@coe_xfr_sql_profile.sql b9ad7h2rvtxwf 3569562598

-- run generated script

@coe_xfr_sql_profile_b9ad7h2rvtxwf_3569562598.sql

Then the performance issues all went away because b9ad7h2rvtxwf went back to running in .1 seconds.  Here is a previous post related to using sqlt this way.

The thing that strikes me about this scenario is that it really isn’t very hard to use this method to resolve these kind of issues.  All you need to do is use the awr report and sqlstat.sql script to identify the sql_id and the good plan_hash_value and then you can force it to run this way.

– Bobby

Posted in Uncategorized | 7 Comments

Script to see wait time over an interval

Another simple script: zip.

This is like an AWR report where you see a difference in v$ view values over time.  But, it is for  one wait event over a single interval.  Simple but possibly useful.

drop table waitdiff;

create table waitdiff as
select * from v$system_event
where event='&&WAITNAME';

host sleep &&INTERVALSECONDS

select 
s.event,
(s.TOTAL_WAITS-d.TOTAL_WAITS) "Number of waits",
(s.TIME_WAITED_MICRO-d.TIME_WAITED_MICRO)/
(s.TOTAL_WAITS-d.TOTAL_WAITS) "Avg microseconds"
from
waitdiff d,
v$system_event s
where 
d.event=s.event and
(s.TOTAL_WAITS-d.TOTAL_WAITS) > 0;

WAITNAME is the wait event such as “log file sync”.  INTERVALSECONDS is how long you want to wait between checks of the waits – i.e. 60 for 60 seconds.

Slightly edited output:

EVENT                    Number of waits Avg microseconds
------------------------ --------------- ----------------
log file parallel write            11412       2642.81151

– Bobby

Posted in Uncategorized | Leave a comment

Script to see single wait per hour

I’ve taken a script I use to show a particular wait event over time and parameterized it a bit to make it more general.

Here is a zip of the script: zip(updated).

This is the same sort of information you see in an AWR report but just for one event and over all of the snapshots you have in your AWR.

Here is the main query:

select sn.END_INTERVAL_TIME,
(after.total_waits-before.total_waits) "number of waits",
(after.time_waited_micro-before.time_waited_micro)/
(after.total_waits-before.total_waits) "ave microseconds",
before.event_name "wait name"
from DBA_HIST_SYSTEM_EVENT before, 
DBA_HIST_SYSTEM_EVENT after,
DBA_HIST_SNAPSHOT sn
where before.event_name='&&WAITNAME' and
after.event_name=before.event_name and
after.snap_id=before.snap_id+1 and
after.instance_number=1 and
before.instance_number=after.instance_number and
after.snap_id=sn.snap_id and
after.instance_number=sn.instance_number and
(after.total_waits-before.total_waits) > &&MINIMUMWAITS
order by after.snap_id;

Here is a description of the two variables:

WAITNAME = Wait event like “log file sync”.

MINIMUMWAITS = Least amount of waits per hour to show that hour’s events.  Sometimes it is helpful to remove the hours where there isn’t much activity.

Here is some output with WAITNAME=log file sync and MINIMUMWAITS=100000:

END_INTERVAL_TIME          number of waits ave microseconds
-------------------------- --------------- ----------------
08-SEP-13 04.00.24.598 AM           194356       802.426964
08-SEP-13 05.00.38.147 AM           301482       705.784296
08-SEP-13 07.00.05.089 AM           162397       2736.56333
08-SEP-13 08.00.19.046 AM           333388       2380.95826
08-SEP-13 09.00.33.324 AM           439911       2469.45262
08-SEP-13 10.00.47.515 AM           697083        2847.4531
08-SEP-13 11.00.01.544 AM           744137       3424.96033
08-SEP-13 12.00.15.859 PM           731348       4022.53643
08-SEP-13 01.00.30.117 PM           674319       3691.63971
08-SEP-13 02.00.44.221 PM           748557        3108.9068

You can use this to identify changes in a waits average time and use an AWR report to do a deeper dive on any interval where you see something different from what is normal.

– Bobby

Posted in Uncategorized | 5 Comments