ORA-30926 on MERGE statement

I was on call last week and I got a ticket about a batch job that was failing on a MERGE statement with an ORA-30926 error. Our support team worked around it by deleting some duplicate rows in a table that was feeding into the MERGE. This week I wanted to go back and try to understand what would cause ORA-30926 errors on MERGE statements.

I read through some blog posts and Oracle support documents relating to ORA-30926 and merge. Then I tried building some simple test scripts to see when you get ORA-30926 on a MERGE. At the end of my search I came back to this simple statement from the 18c SQL Language Reference manual’s description of the MERGE statement:

MERGE is a deterministic statement. You cannot update the same row of the target table multiple times in the same MERGE statement.

I was puzzled by the term “deterministic” but “cannot update the same row…multiple times” seems simple enough. I created test scripts to show whether you can update the same row multiple times with a MERGE: zip

Here are the two test tables:

create table target (a number,b number);

create table source (a number,b number);

Here is data and a MERGE statement that causes the error:

SQL> insert into target values (1,1);
SQL> insert into source values (1,2);
SQL> insert into source values (1,3);

SQL> merge into target
  2  using source
  3  on (target.a = source.a)
  4  when matched then
  5  update set target.b=source.b;
using source
      *
ERROR at line 2:
ORA-30926: unable to get a stable set of rows in the source tables 

This seems very simple. We join the source and target tables on column A with value 1. The merge statement tries to update column B on the target table row twice. It tries to set it to 2 and then to 3. I guess this is where the term “deterministic” comes in. If the merge statement updated B to 2 and 3 which would it do first and which second?

The example above with values 2 and 3 for B makes good sense but I saw some odd behavior when I used source rows with 1 and 2 for the B values of the two rows. With B values of 1 and 2 in this case the MERGE does not get an error:

SQL> insert into target values (1,1);
SQL> insert into source values (1,1);
SQL> insert into source values (1,2);

SQL> merge into target
  2  using source
  3  on (target.a = source.a)
  4  when matched then
  5  update set target.b=source.b;

2 rows merged.

SQL> select * from target;

         A          B                                                           
---------- ----------                                                           
         1          2                                                           

This seems to contradict the idea that you cannot update the same row multiple times with a MERGE. In this case it seems like B is updated twice, once to 1 which is what it already was set to and then to 2. I guess this works because B was already set to 1 so the update of B to the same value does not count as an update. It seems like only one update took place and then B ends up set to 2.

This example does not work with a slightly different MERGE statement on Oracle 12.1 or earlier:

SQL> select banner from v$version;

BANNER                                                                          
--------------------------------------------------------------------------------
Oracle Database 12c Enterprise Edition Release 12.1.0.2.0 - 64bit Production    

SQL> merge into target
  2  using source
  3  on (target.a = source.a)
  4  when matched then
  5  update set target.b=source.b
  6  when not matched then
  7  insert values (source.a,source.b);
using source
      *
ERROR at line 2:
ORA-30926: unable to get a stable set of rows in the source tables 

SQL> select * from source;

         A          B                                                           
---------- ----------                                                           
         1          1                                                           
         1          2                                                           

SQL> 
SQL> select * from target;

         A          B                                                           
---------- ----------                                                           
         1          1                                                           

All that I can say based on these two tests is that sometimes an update of a column to the same value counts as an update and sometimes it does not. The preceding example works on 12.2:

SQL> select banner from v$version;

BANNER                                                                          
--------------------------------------------------------------------------------
Oracle Database 12c Enterprise Edition Release 12.2.0.1.0 - 64bit Production    

SQL> merge into target
  2  using source
  3  on (target.a = source.a)
  4  when matched then
  5  update set target.b=source.b
  6  when not matched then
  7  insert values (source.a,source.b);

2 rows merged.

SQL> select * from source;

         A          B                                                           
---------- ----------                                                           
         1          1                                                           
         1          2                                                           

SQL> 
SQL> select * from target;

         A          B                                                           
---------- ----------                                                           
         1          2                                                           

It all seemed so simple when I read the documentation. Maybe instead of saying:

You cannot update the same row of the target table multiple times in the same MERGE statement.

Instead it should say:

You may not be able to update the same row of the target table multiple times in the same MERGE statement.

We should not count on being able to update the same row multiple times with a single MERGE statement, but clearly there are some cases in which we can. If you are like me and you get paged on a job that fails with ORA-30926 on a MERGE, it makes sense to get rid of the multiple updates on a single row because you most likely have hit a case where it is not allowed.

Bobby

Posted in Uncategorized | 6 Comments

One query in MySQL Performance Schema

I am learning about MySQL performance tuning. I read the Performance Schema chapter of the MySQL 5.7 manual and I have a MySQL 5.7.20 database running under Linux. I have a test table and I am running a simple query that does a full scan of the table and returns the sum of a couple of columns. The goal was to look at some Performance Schema tables to see what they would tell me about this simple query. I bounce the MySQL database service before running my test script so that the query pulls data from disk and not memory. A zip of my test script and its output is here: zip

I looked at the tables that had this pattern events_*_history_long. These are the four tables:

There seems to be a hierarchical relationship among these tables something like this:

  • statements->transactions
  • statements->stages->waits->waits

There may be other relationships that my simple test did not capture. If you look at the zip you will see all the levels of the hierarchy that I explored but, in this case, the bottom level seems the most interesting. Here is the query that explores the bottom of the statements->stages->waits->waits path:

select * from events_waits_history_long
where
NESTING_EVENT_ID in 
(select EVENT_ID from events_waits_history_long
where
NESTING_EVENT_ID in 
(select EVENT_ID from events_stages_history_long
where
NESTING_EVENT_ID in 
(select EVENT_ID from events_statements_history_long
where SQL_TEXT like concat('%te','st%'))
and NESTING_EVENT_TYPE = 'STATEMENT')
and NESTING_EVENT_TYPE = 'STAGE')
and NESTING_EVENT_TYPE = 'WAIT'
order by EVENT_ID;

The output reminds me of a trace in Oracle. It shows the individual disk reads and waits for internal locks and mutexs.

Most of the time seems to be taken up on reads from a file, which is what I expected. If you look at the wait/io/file/innodb/innodb_data_file waits they seem to be 16384 byte reads from the file associated with the table. I could use this information to build a query to show a profile of the time spent by the query based on EVENT_NAME. It would be kind of like a tkprof of an Oracle trace.

This post is just a simple first test. I am new to MySQL tuning so feel free to leave a comment or email me if you have suggestions or corrections related to this post.

Bobby

P.S. Looking at this again, it does not look like the file reads are really physical I/O because they are too short. The TIMER_WAIT column uses picoseconds so if you divide 3499928 by 1000000 you should get 3.49 microseconds for the first read which is tiny compared to a normal disc read of 1000 microseconds or more. Also, I added up all the wait times from the statements->stages->waits->waits query and the total was about 100 times less than the query run time. The higher levels of this hierarchy all had waits in the half second range, but the lowest level of waits adds to about one hundredth of that. So, I have more work to do at this point.

P.P.S. Looks like the reads are all from memory. I looked at several things but here is a profile of the waits from the stage level and then at the wait level:

+-------------------------------------------+---------------+
| EVENT_NAME | total_seconds |
+-------------------------------------------+---------------+
| wait/io/table/sql/handler | 0.4819 |
| wait/io/socket/sql/client_connection | 0.0001 |
| wait/synch/mutex/sql/THD::LOCK_query_plan | 0.0000 |
| wait/synch/mutex/sql/LOCK_table_cache | 0.0000 |
| wait/synch/mutex/sql/THD::LOCK_thd_query | 0.0000 |
| wait/synch/mutex/innodb/trx_mutex | 0.0000 |
| wait/synch/mutex/sql/THD::LOCK_thd_data | 0.0000 |
+-------------------------------------------+---------------+
+-------------------------------------------+---------------+
| EVENT_NAME | total_seconds |
+-------------------------------------------+---------------+
| wait/io/file/innodb/innodb_data_file | 0.0041 |
| wait/synch/mutex/innodb/buf_pool_mutex | 0.0004 |
| wait/synch/sxlock/innodb/hash_table_locks | 0.0002 |
| wait/synch/mutex/innodb/fil_system_mutex | 0.0001 |
+-------------------------------------------+---------------+

It seems that the wait/io/table/sql/handler event includes the CPU to process the query which takes about half a second whereas the wait/io/file/innodb/innodb_data_file event seems to just cover the time to read the data from the buffer pool. Here is a zip of my script to create these profiles and its output: zip

I got a profile of the query another way and that confirmed that almost all of the half second run time of the query was CPU:

Sending data spends .52 seconds on the CPU which is most of the query’s .54 second run time in this case.

P.P.P.S. This post, https://mysql.wisborg.dk/2018/08/05/what-does-io-latencies-and-bytes-mean-in-the-performance-and-sys-schemas/, says that wait/io/table/sql/handler events can be reads from the buffer pool but that wait/io/file/innodb/innodb_data_file events are actual reads from the file system. I can only assume that the data is cached by a Linux filesystem cache if this is true, because the wait/io/file/innodb/innodb_data_file events are much too short to be a read from disk. By the way, the disk in this case is an external hard drive on my laptop connected through USB. Typical I/O times are around 20 milliseconds. So, reads from the filesystem that finish in a few microseconds have to be coming from memory.

P.P.P.P.S. I looked at the source code and it looks like the wait/io/file/innodb/innodb_data_file wait events are physical I/O. But I had a hard time forcing a really slow read from the table. Setting innodb_flush_method=O_DIRECT in my /etc/my.cnf file and bouncing the MySQL service resulted in a slower query the first time I ran it, but then everything was cached in the database’s buffer pool and run time was back to half a second. It seems that the first time I run the query it does a small amount of physical I/O but the data for this small table is cached somewhere. I am running VirtualBox on top of my Windows 7 laptop so maybe the table’s data is cached in Windows even after turning on direct I/O to bypass the filesystem cache at the Linux level within the VM. This is all the same sort of thing you see with Oracle database tuning. You must navigate the many layers of cache between the database and the physical disk when you look at physical I/O times.

Posted in Uncategorized | 5 Comments

SQL Profile not used on slightly different query

Last week I was asked to help with a performance problem that looked a lot like a problem I fixed in July with a SQL Profile. The query whose plan I fixed back in July was modified by a minor application change over the weekend. A single column that was already in the select clause was added to another part of the select clause. As a result, the SQL_ID for the new query was different than the one for the July query. The SQL Profile from July associated SQL_ID 2w9nb7yvu91g0 with PLAN_HASH_VALUE 1178583502, but since the SQL_ID was now 43r1v8v6fc52q the SQL Profile was no longer used. At first, I thought I would have to redo the work I did in July to create a SQL Profile for the new query. Then I realized that the plan I used in July would work with the new SQL_ID so all I did was create a SQL Profile relating SQL_ID 43r1v8v6fc52q with PLAN_HASH_VALUE 1178583502 and the problem was solved. This is an 11.2.0.3 database running on the HP-UX Itanium platform. Here is a post from 2013 explaining how to create a SQL Profile: url. I thought it would be helpful to use this post to go over the steps that I went through with the July incident and how I originally generated the good plan. Then I wanted to make some comments about the various ways I come up with good plans for SQL Profiles by either generating a new better plan or by finding an older existing better one. Lastly, I wanted to talk about how a given good plan can be used for a variety of similar SQL statements.

The problem query that I worked on in July and many of the other SQL statements that I tune with SQL Profiles have bind variables in their where clauses. Usually the optimizer generates the plan for a query with bind variables once based on the values of the bind variables at that time. Then, unless the plan is flushed out of the shared pool, the query continues to run on the same plan even if it is horribly inefficient for other bind variable values. There is a feature that will cause the optimizer to run different plans based on the bind variable values in some cases but the SQL statements that I keep running into do not seem to use that feature. Since the query I worked on in July had bind variables I assumed that it was a typical case of a plan that worked well for one set of bind variables and that was terribly slow for another set. So, I had to find a set of bind variable values that made the query slow and figure out a better plan for those values. I used my bind2.sql script to extract the bind variable values for the problem query when I was working on the problem in July.

After extracting the bind variables, I used an AWR report to figure out which part of the plan contributed the most to the run time of the query so that I knew which bind variable value was causing the slowdown. Using an AWR report in this way only works if you do not have a bunch of slow SQL statements running at the same time. In this case the problem query 2w9nb7yvu91g0 was dominating the activity on the database with 62.19% of the total elapsed time. If there were a bunch of SQL Statements at the top of this list with similar percent of total values, it might be hard to use the AWR report to find information about this one query.

Since the activity for 2w9nb7yvu91g0 was 87.19% CPU I looked for the segments with the most logical reads. Logical reads are reads from memory, so they consume CPU and not disk I/O. In the graph below the segment for the S_ACCNT_POSTN table has 88.60% of the logical reads so most likely this segment caused the slowness of the query’s plan.

I looked at the plan for 2w9nb7yvu91g0 to see where the most heavily read table was used. This would probably be the source of the slow query performance. I found that it was doing a range scan of an index for the S_ACCNT_POSTN table that had the column POSITION_ID as its first column. This made me suspect that the plan was using the wrong index. If an index was used to retrieve many rows from the table that could take a long time. I did a count on all the rows in the table grouping by POSITION_ID and found that most rows had a specific value for that column. I replaced the actual POSITION_ID values with VALUE1, VALUE2, etc. below to hide the real values.

POSITION_ID            CNT
--------------- ----------
VALUE1             2075039
VALUE2               17671
VALUE3                8965
VALUE4                5830
VALUE5                5502
VALUE6                5070
VALUE7                4907
VALUE8                4903

Next, I verified that the query had an equal condition that related a bind variable to the POSITION_ID column of the problem table. This made me suspect that the plan in the shared pool was generated with a bind variable value for POSITION_ID other than VALUE1. So, that plan would work well for whatever value was used to create it. POSITION_ID would be equal to that value for a small percentage of the rows in the table. But, running the query in SQL*Plus with POSITION_ID=’VALUE1′ caused the optimizer to choose a plan that made sense given that this condition was true for most of the rows in the table. The PLAN_HASH_VALUE for the new plan was 1178583502.

I tested 1178583502 against a variety of possible bind variable values by using an outline hint in SQL*Plus scripts to force that plan no matter which values I tested against. I extracted the outline hint by running the query with POSITION_ID=’VALUE1′ and using this dbms_xplan call:

select * from table(dbms_xplan.display_cursor(null,null,'OUTLINE'));

Then I just added the outline hint to a copy of the same SQL*Plus script and tried various combinations of bind variable values as constants in the where clause just as I had tried VALUE1 for POSITION_ID. I used the values that I had extracted using bind2.sql. After verifying that the new plan worked with a variety of possible bind variable values, I used a SQL Profile to force 2w9nb7yvu91g0 to use 1178583502 and the problem was resolved.

I have just described how I created the original July SQL Profile by running a version of the problem query replacing the bind variables with constants that I knew would cause the original plan to run for a long time. The optimizer chose a better plan for this set of constants than the one locked into the shared pool for the original query. I used the PLAN_HASH_VALUE for this plan to create a SQL Profile for the July query. This is like an approach that I documented in two earlier blog posts. In 2014 I talked about using a hint to get a faster plan in memory so I could use it in a SQL Profile. In 2017 I suggested using an outline hint in the same way. In both of those cases I ran the problem query with hints and verified that it was faster with the hints. Then I used a SQL Profile to force the better PLAN_HASH_VALUE onto the problem query. So, in all these cases the key is to generate a better plan in any way possible so that it is in memory and then create a SQL Profile based on it. A lot of times we have queries that have run on a better plan in the past and we just apply a SQL Profile that forces the better plan that is already in the system. My December, 2018 post documents this type of situation. But the 2014 and 2017 blog posts that I mentioned above and the July 2018 example that I just described all are similar in that we had to come up with a new plan that the query had never used and then force it onto the SQL statement using a SQL Profile.

The incidents in January and July and the cases where I added hints all lead me to wonder how different one SQL statement can be from another and still share the same plan. The problem last week showed that two queries with slightly different select clauses could still use the same plan. The other cases show that you can add hints or run the statement with bind variables replaced with constants. In the January case I did not have to go back through the analysis that I did in July because I could quickly force the existing plan from the July query onto the January one. The January problem also shows the limits of SQL Profiles. The slightest change to a SQL statement causes a SQL Profile to be ignored, even though the plan would still work for the new SQL statement. But in the January case the ability to use the same plan for slightly different queries made it easy to create a new SQL Profile.

Bobby

Posted in Uncategorized | 2 Comments

Slides From January 2019 AZORA Meeting

Here are slides from the January 2019 AZORA Meeting with Charles Kim and Viscosity:

Oracle Database 12.2 New Features

Oracle Database 18c New Features

Thank you to Charles and Viscosity for making our meeting a big success, and thanks for sharing these slides.

Bobby

Posted in Uncategorized | Leave a comment

MIT’s Free Algorithms Track

MIT, the Massachusetts Institute of Technology, has published a free set of three undergraduate level Algorithms classes that I recommend to the readers of this blog. These are links to the three classes in the order that they should be taken.

Mathematics for Computer Science (Spring 2015)

Introduction to Algorithms (Fall 2011)

Design and Analysis of Algorithms (Spring 2015)

I took the 2010 version of the Mathematics for Computer Science class and I am almost done with the Introduction to Algorithms class. I am considering taking the third class next. I want to use this post to explain why I recommend this set of three classes.

All three of these classes have video lectures. These classes are part of a massive collection of free educational information that MIT publishes on its OCW or Open Courseware web site: ocw.mit.edu. I have focused on the Computer Science classes out of the many available. But only certain classes contain video. For example, the Database Systems class does not have video. It does have free lecture notes and other content that has real value, but the Algorithms track has three classes in a row with video and that makes them especially valuable.

In addition to the video content all three classes have valuable static content such as lecture notes. The Mathematics for Computer Science class has a free online textbook. It looks like the 2015 version has all kinds of interesting extra content that was not in the 2010 class that I took, and I thought the 2010 class was great. The last two classes have solutions to the problem sets, quizes, and exams which is great when you are studying this on your own.

The Introduction to Algorithms and Design and Analysis of Algorithms classes have a highly regarded standard Algorithms textbook for their readings. It is Introduction to Algorithms, 3rd Edition by by Thomas H. Cormen, Charles E. Leiserson, Ronald L. Rivest, Clifford Stein. This textbook is commonly referred to as CLRS and seems to be the standard textbook for people who are serious about Algorithms.

The price is right. All three of these classes are free. I did buy CLRS, or actually I got it as a present, so my wife’s parents bought it, but $65 is a worthwhile investment especially since it is the text for two of the three classes and a valuable reference afterwards. The first class is completely free since it has a free text book included. The three classes represent thousands of dollars’ worth of educational material for free.

These classes are not easy. I do not claim to have mastered this material. It is hard to really discipline yourself to study for a class by yourself without grades and deadlines and others to talk to about it. But I have learned a lot from the two classes that I have worked through. I am a little afraid to take on the third class which is the intermediate level Algorithms class. Yikes! But even if I struggle to fully grasp every assignment, I am learning something. Some of it is a reminder of things I learned long ago in college, but many things are new. So, I do not mind the classes being hard. Better hard than too easy.

So, if you want to learn about Algorithms this three-class sequence is a great way to go. But, why would readers of this blog want to study this subject? In my opinion, Algorithms is just one area of Computer Science that would be helpful for a database professional to learn. Obviously, it is great to learn about database theory if you work with databases. It is great to learn about other systems topics such as operating systems and compilers since your work uses this type of software. It is great to learn about hardware, software development, etc. I think that many aspects of my Computer Science background from long ago in school have helped me in my database job. So, I do not think that Algorithms is the most important or only thing within CS that a database person needs to know, but I do think that Algorithms is very helpful to database workers.

I think that all of the main topics within CS that a database person would want are covered on the list of OCW EE and CS classes. But it seems that Algorithms is unique in that it has a very nice three class sequence that is so fully developed with video and the other resources that I mentioned. Maybe there are other areas that I missed, but I know that Algorithms is well covered by OCW. So, that is why I am singling out this three-class sequence in this blog post. I believe that it is an especially well covered topic within Computer Science that is useful to database professionals and available for free. So, check it out!

Bobby

Posted in Uncategorized | 2 Comments

January 25th AZORA Meetup with Viscosity

If you are in the Phoenix, Arizona area on Friday, January 25th please come to the AZORA meetup with talks by Viscosity. Please RSVP on the meetup site so we know how much food to order: Meetup link. We have a great lineup of speakers with talks about new features of the latest Oracle database versions. I know that I have not kept up with all the latest features, especially with all the other technical training that is on my plate. So, I am looking forward to setting aside this dedicated time to learn about Oracle database features from highly qualified presenters.

Plus, it will be fun and includes lunch! Come join us for our first meeting of the new year.

Bobby

Posted in Uncategorized | Leave a comment

Long running queries and my DBA_HIST_SQLSTAT scripts

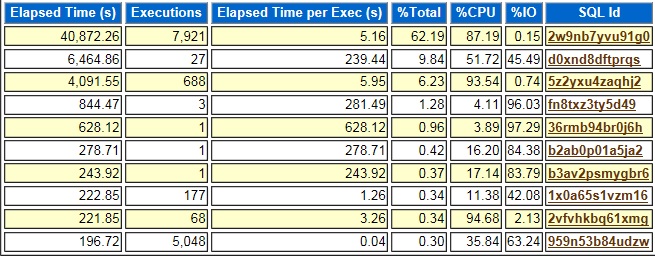
On December 2nd we ran into a problem with one of my scripts that uses the DBA_HIST_SQLSTAT view. It did not show the full run time of a SQL statement that ran for several hours. So, it hid the fact that the plan that the SQL statement was using was much less efficient than another better plan. This post will document the two DBA_HIST_SQLSTAT scripts that I have been using so far and will introduce a new script that should make it clearer that a SQL statement is running for several hours on a plan.

There are two scripts that are based on DBA_HIST_SQLSTAT that I use most often for tuning: sqlstat.sql, sqlstat2.sql. I use these scripts all the time to look at the performance of queries and the different execution plans that they use. But in this case the output of sqlstat.sql was misleading. Here is part of its output for the problem SQL statement am47wcwn336yj:

PLAN_HASH_VALUE END_INTERVAL_TIME         EXECUTIONS_DELTA Elapsed Average ms
--------------- ------------------------- ---------------- ------------------
     3771021445 04-NOV-18 05.00.15.814 AM                1            2250696
     2117190322 11-NOV-18 03.01.00.265 AM                6         223502.352
     1484468961 18-NOV-18 06.00.22.364 AM                1         2695964.96
     2117190322 25-NOV-18 02.00.34.302 AM                3         198192.968
     1139203276 02-DEC-18 07.00.21.784 AM                1          322110.53

We got a performance ticket at about 9 am on December 2nd about a session with SQL ID am47wcwn336yj running for longer than normal. Based on the sqlstat.sql output above you would think that the current plan is 1139203276 and that it is a little slower than the other plans but not terrible. The problem is that sqlstat.sql only shows you SQL executions that have completed during the hour prior to the END_INTERVAL_TIME. So, one execution of am47wcwn336yj completed between 6 and 7 am on December 2nd, but the output makes it look like it only ran for 322110.53 milliseconds which is about 5 minutes. Really it probably ran for several hours and completed around 6:05 am. So, we thought that 1139203276 was an ok plan when really 2117190322 is the much more efficient plan. But, the sqlstat.sql output confused us because it did not show the hours where am47wcwn336yj was running with plan 1139203276 but had not completed. It is easy to see why sqlstat.sql leaves out these hours if you look at this condition in its where clause:

and executions_delta > 0

This part of the where clause conditions prevents you from seeing where the SQL statement is still running. But the select clause contains a division by executions_delta so you cannot have divide by zero so that is why I excluded it.

When I am working on a long running SQL statement that spans two or more hours, I run sqlstat2.sql after I run sqlstat.sql. Sqlstat2.sql shows all the time spent per hour regardless of whether a SQL statement’s execution completed. It does not have the condition requiring executions_delta to be > 0 because it does not divide by that column. Here is the output for am47wcwn336yj:

PLAN_HASH_VALUE END_INTERVAL_TIME         EXECUTIONS_DELTA ELAPSED_TIME_DELTA
--------------- ------------------------- ---------------- ------------------
     3771021445 04-NOV-18 03.00.43.465 AM                0         3584030311
     3771021445 04-NOV-18 04.00.27.516 AM                0         3588264762
     3771021445 04-NOV-18 05.00.15.814 AM                1         2250695998
     2117190322 11-NOV-18 03.01.00.265 AM                6         1341014109
     1484468961 18-NOV-18 02.00.07.772 AM                0         3171408998
     1484468961 18-NOV-18 03.00.58.545 AM                0         3648125526
     1484468961 18-NOV-18 04.00.44.680 AM                0         3586687594
     1484468961 18-NOV-18 05.00.32.832 AM                0         3592026797
     1484468961 18-NOV-18 06.00.22.364 AM                1         2695964960
     2117190322 25-NOV-18 02.00.34.302 AM                3          594578904
     1139203276 02-DEC-18 02.00.14.082 AM                0          480039949
     1139203276 02-DEC-18 03.00.05.255 AM                0         3591464884
     1139203276 02-DEC-18 04.00.50.936 AM                0         3645014119
     1139203276 02-DEC-18 05.00.40.304 AM                0         3591817904
     1139203276 02-DEC-18 06.00.31.820 AM                0         3587861998
     1139203276 02-DEC-18 07.00.21.784 AM                1          322110530
     1139203276 02-DEC-18 09.00.58.127 AM                0         2028205794
     1139203276 02-DEC-18 10.00.37.793 AM                0         3582326580

Here you can see that plan 1139203276 ran between 1 and 7 am on 02-DEC-18 and completed and then ran between 8 and 10 am and never completed. We ended up killing the long running session and we reran the SQL another way so there is no more history of it. The problem with sqlstat2.sql is that it does not show average elapsed time per execution like sqlstat.sql does. It just shows the total elapsed time for all executions, if any. This is because we don’t divide by executions_delta. Also, the units are microseconds instead of milliseconds. I find milliseconds to be easier to use.

To me looking at the output from sqlstat.sql and the output from sqlstat2.sql 2117190322 is the best plan. It is clear to me because I wrote these two scripts and am used to the way they look in this situation. If you go back to the first output, you can see that plan 2117190322 averages less than 224 seconds per execution (223502.352 ms and 198192.968 ms). Plans 3771021445, 1484468961, and 1139203276 ran for multiple hours. You can tell this because there are multiple consecutive hours with those plans and 0 executions.

I have used sqlstat.sql and sqlstat2.sql a lot as they are but today, I got the idea of combining them into a script that shows average elapsed time per execution for a given hour and includes hours where an execution did not complete. I have not used it yet in a real performance tuning situation but here it is, cleverly named sqlstat3.sql. Here is its output for this situation:

PLAN_HASH_VALUE END_INTERVAL_TIME         EXECUTIONS_DELTA Elapsed Average ms
--------------- ------------------------- ---------------- ------------------
     3771021445 04-NOV-18 03.00.43.465 AM                0         3584030.31
     3771021445 04-NOV-18 04.00.27.516 AM                0         3588264.76
     3771021445 04-NOV-18 05.00.15.814 AM                1            2250696
     2117190322 11-NOV-18 03.01.00.265 AM                6         223502.352
     1484468961 18-NOV-18 02.00.07.772 AM                0            3171409
     1484468961 18-NOV-18 03.00.58.545 AM                0         3648125.53
     1484468961 18-NOV-18 04.00.44.680 AM                0         3586687.59
     1484468961 18-NOV-18 05.00.32.832 AM                0          3592026.8
     1484468961 18-NOV-18 06.00.22.364 AM                1         2695964.96
     2117190322 25-NOV-18 02.00.34.302 AM                3         198192.968
     1139203276 02-DEC-18 02.00.14.082 AM                0         480039.949
     1139203276 02-DEC-18 03.00.05.255 AM                0         3591464.88
     1139203276 02-DEC-18 04.00.50.936 AM                0         3645014.12
     1139203276 02-DEC-18 05.00.40.304 AM                0          3591817.9
     1139203276 02-DEC-18 06.00.31.820 AM                0            3587862
     1139203276 02-DEC-18 07.00.21.784 AM                1          322110.53
     1139203276 02-DEC-18 09.00.58.127 AM                0         2028205.79
     1139203276 02-DEC-18 10.00.37.793 AM                0         3582326.58

The nice thing is that you can see that 2117190322 ran 6 times averaging 223502.352 milliseconds on November 11 and 3 times averaging 198192.968 milliseconds on November 25th. Plus, you can see that the other plans span multiple hours. Note that the plans that span a full hour run for about 3600000 milliseconds which is an hour so that supports the idea that the SQL statement is active throughout the entire hour. I have only shown some of the total output to fit on the screen, but the full output includes more information such as a CPU and IO breakdown of the run time.

Anyway, the point is that the main DBA_HIST_SQLSTAT query that I use, sqlstat.sql does not show SQL statements that run for several hours very clearly. You can figure it out using sqlstat2.sql in addition to sqlstat.sql. The new sqlstat3.sql script may make it easier to diagnose multi-hour SQL statement executions in the future without having to use two scripts.

Bobby

P.S. See this post about how I consolidated sqlstat.sql, sqlstat2.sql and sqlstat3.sql into one script, sqlstat.sql:

https://www.bobbydurrettdba.com/2020/04/14/fixed-issue-with-dba_hist_sqlstat-script/

Posted in Uncategorized | Leave a comment

To Blog, or Not to Blog?

As 2018 is ending I am thinking about what I spend my time on. Do I have my priorities correct? I know that I should spend some part of my time interacting with people over the Internet. I have gotten so much benefit from talking with other people about Oracle database issues through web-based forums. I have also had some in person interactions. I’m excited about the sort of rebirth of AZORA, my local Arizona Oracle user group. I talk to human beings in person about Oracle at user group meetings and that has great value. But I noticed that it had been a while since my last blog post of any substance. So, I asked myself if I am losing interest in blogging. I have not lost interest in writing blog posts, but I have had many other things tugging for my time, including other ways to interact with people over the Internet. So, I need to think about how much time to allocate to this blog next year.

I blame part of my lack of blog verbosity on Python. I have written a number of Python related posts, but Python has also drawn me into interacting with Rosetta Code and Stack Overflow. I’m trying to keep up my Python skills so that I have a general-purpose programming language available in my tool kit. But any time I might have devoted to my blog may have gotten used up by these Python related sites. Even GitHub is a form of distraction because maintaining Python repositories there takes time. But I don’t regret any time spent on Python because it is such a popular language now and it has really helped me in my work.

I guess the second time sink has been my PeopleSoft work. I don’t really talk much about my PeopleSoft work on this blog, but I have done a lot more of this sort of work in 2018 than I ever would have expected. With the push to move to the cloud and move to non-Oracle databases I have nevertheless been doing a bunch of old fashioned on premises ERP support, PeopleSoft applications on Oracle databases. I’ve been doing PeopleSoft on Oracle database for at least 24 years now so if my employer needs this sort of work, I’m capable of doing it. But PeopleSoft doesn’t excite me as much as database internals and performance tuning so that’s why I don’t blog about it much.

Speaking of the cloud and non-Oracle database, I have done some work in these areas in 2018 but not as much as I would have liked. I probably wouldn’t blog about the basics of using AWS or MySQL RDS, but if I can dig into some MySQL internals and use or build some MySQL performance tools, I can see blogging about that. My experience is mostly with Oracle, but I think open source is neat. I like having the MySQL and PostgreSQL source code even if I am unfamiliar with it. So, I guess I haven’t blogged about the cloud and non-Oracle databases because I just haven’t gotten very far. Maybe next year.

But, why have I not blogged about Oracle performance tuning? That really is the question. There have been several performance issues that I have worked on over the past few months, but in many cases, they were not anything new to me. Still, I think I may have missed out by not documenting the steps I went through in some of these real issues. I think it is easy to feel like what I am writing is not anything new and that there are better Oracle performance tuning bloggers out there. Also, I worry that I will make a mistake and confuse people or mislead them with wrong information. I would not intentionally mislead anyone, but I can certainly be wrong! I think going forward in 2019 I want to make the effort to write blog posts about Oracle performance issues that I have resolved even if they are not especially new territory. I probably can find some interesting angle from most issues. I think it might help people to see how I am using my SQL*Plus and Python scripts in different scenarios. Anyway, I hope to get back to blogging about Oracle performance.

Topics of my 15 blog posts in 2018 to this point:

User Group6
Oracle4
Python3
MySQL2

My Shakespeare inspiration (To be, or not to be):


To be, or not to be, that is the question:
Whether ’tis nobler in the mind to suffer
The slings and arrows of outrageous fortune,
Or to take Arms against a Sea of troubles…

Hamlet. Act III, Scene I

Posted in Uncategorized | 4 Comments

Parallel_degree_policy AUTO caused serial plan in qat

Recently during testing a merge statement was running forever in our qat environment after a simple change. We had simply added a few columns to an existing table. After looking around we found that our qat environment had the parameter parallel_degree_policy set to AUTO, but our other environments had it set to MANUAL. I thought I would show how we figured this out.

I had the SQL_ID for the problem merge statement and used my sqlstat.sql script to see if the same merge statement ran in production. I did not find any production executions. I was told that this merge statement was already in our production code and ran all the time without an issue. So, then I used my findsql.sql script to find the SQL_ID of the production version of the merge statement. 

To use findsql.sql you have to edit it to replace MYUSER with a real user on your database. I use my own personal user. Then you have to update the LIKE statement in the where clause to identify the query that you want. I replaced this line in the findsql.sql text on GitHub:

SQL_TEXT like '%a.FISC_WK_OF_Yr < to_number(to_char(sysdate+1, ''iW''))%' and

with this line which is part of the text of the problem merge statement:

upper(SQL_TEXT) like upper('%MERGE INTO DDMADM.FWB_MDL MDL%') and

I easily found the equivalent merge statement in production. The QAT merge statement had SQL_ID 00cmatqz5wymd and the prod one had 7pgqd82bgdah2. My coworker, who had brought me in on this issue, said that on QAT the query was not running in parallel. So, I used my getplans.sql script to look at the two plans. On prod the plan used parallelism:

-----------------------------------------
| Id  | Operation                        
-----------------------------------------
|   0 | MERGE STATEMENT                  
|   1 |  MERGE                           
|   2 |   TEMP TABLE TRANSFORMATION      
|   3 |    PX COORDINATOR                
|   4 |     PX SEND QC (RANDOM)          
|   5 |      LOAD AS SELECT              
|   6 |       UNION-ALL                  
|   7 |        WINDOW SORT               
|   8 |         PX RECEIVE               
|   9 |          PX SEND HASH            
|  10 |           VIEW                   
|  11 |            UNPIVOT               
|  12 |             PX BLOCK ITERATOR    
|  13 |              TABLE ACCESS FULL   

On QAT it did not:

-----------------------------------------------------
| Id  | Operation                                    
-----------------------------------------------------
|   0 | MERGE STATEMENT                              
|   1 |  MERGE                                       
|   2 |   VIEW                                       
|   3 |    NESTED LOOPS OUTER                        
|   4 |     VIEW                                     
|   5 |      TEMP TABLE TRANSFORMATION               
|   6 |       LOAD AS SELECT                         
|   7 |        UNION-ALL                             
|   8 |         WINDOW SORT                          
|   9 |          VIEW                                
|  10 |           UNPIVOT                            
|  11 |            PARTITION RANGE SINGLE            
|  12 |             TABLE ACCESS BY LOCAL INDEX ROWID
|  13 |              INDEX RANGE SCAN                

I found this extra line at the end of the QAT plan:

- automatic DOP: Computed Degree of Parallelism is 1 because of parallel threshold

This triggered a memory of a coworker of mine who was trying out some degree of parallelism parameters a couple of years ago. After searching the internet, I quickly found that the automatic DOP message was related to the parameter parallel_degree_policy. We found that it was set to manual on prod, so we set it to manual on QAT and the merge statement went back to the expected performance.

I guess the point of this post is to keep a close watch on the messages that show up at the end of your execution plan. They could lead you to a parameter setting that is the source of your problem.

Lastly, this is my first post using the new WordPress Gutenberg plugin. What do you think? It was pretty easy to put in the output from my scripts in little unformatted boxes by themselves. Much easier than with the previous WordPress editor.

Bobby

P.S. I have found one negative to Gutenberg. I can’t find a way to use the Jetpack Proofreading function to check my grammar. So, if you see that I have used passive voice in a bunch of my sentences you will know why. Hopefully they will add this into a future update. Of course, I could just use my brain to check the grammar but where is the fun in that?

P.P.S. I started working on another blog post and found a simple solution to my grammar checking needs using Gutenberg. I just copy and paste the blog post text into Microsoft Word and use its grammar checker. Pretty neat.

Posted in Uncategorized | 2 Comments

Hear my Python for the Oracle DBA talk in Scottsdale on November 16th

I am going to giving a talk about why Python is a good programming language for Oracle DBAs in Scottsdale on November 16th for the Arizona Oracle User Group, AZORA. We may get some other speakers together for the meeting but I will be there for sure. I did this talk for Collaborate and for the RMOUG Training Days earlier this year. I may try to make it a little more interactive if I can get it together in time. I’m thinking of encouraging people to bring their laptops and install Python 3.7.1 so they can play around with a couple of features during the talk. Here is the Meetup information:

https://www.meetup.com/Arizona-Oracle-User-Group/events/255752135/

Let me know if you have any questions about this meeting. It should be fun.

Our meeting sponsor Clarivoyant graciously agreed to provide us with pizza and drinks so don’t worry about lunch!

Search my blog for Python posts if you want to see examples of how I have been using Python for my Oracle DBA work:

https://www.bobbydurrettdba.com/?s=Python

Bobby

Posted in Uncategorized | Leave a comment