We are moving a production database from 10.2 Oracle on HP-UX 64 bit Itanium to 11.2 Oracle on Linux on 64 bit Intel x86. So, we are upgrading the database software from 10.2 to 11.2. We are also changing endianness from Itanium’s byte order to that of Intel’s x86-64 processors. Also, my tests have shown that the new processors are about twice as fast as the older Itanium CPUs.
Two SQL queries stand out as being a lot slower on the new system although other queries are fine. So, I tried to understand why these particular queries were slower. I will just talk about one query since we saw similar behavior for both. This query has sql_id = aktyyckj710a3.
First I looked at the way the query executed on both systems using a query like this:
select ss.sql_id,
ss.plan_hash_value,
sn.END_INTERVAL_TIME,
ss.executions_delta,
ELAPSED_TIME_DELTA/(executions_delta*1000),
CPU_TIME_DELTA/(executions_delta*1000),
IOWAIT_DELTA/(executions_delta*1000),
CLWAIT_DELTA/(executions_delta*1000),
APWAIT_DELTA/(executions_delta*1000),
CCWAIT_DELTA/(executions_delta*1000),
BUFFER_GETS_DELTA/executions_delta,
DISK_READS_DELTA/executions_delta,
ROWS_PROCESSED_DELTA/executions_delta
from DBA_HIST_SQLSTAT ss,DBA_HIST_SNAPSHOT sn
where ss.sql_id = 'aktyyckj710a3'
and ss.snap_id=sn.snap_id
and executions_delta > 0
and ss.INSTANCE_NUMBER=sn.INSTANCE_NUMBER
order by ss.snap_id,ss.sql_id;
It had a single plan on production and averaged a few seconds per execution:
PLAN_HASH_VALUE END_INTERVAL_TIME         EXECUTIONS_DELTA Elapsed Average ms CPU Average ms IO Average ms Cluster Average ms Application Average ms Concurrency Average ms Average buffer gets Average disk reads Average rows processed
--------------- ------------------------- ---------------- ------------------ -------------- ------------- ------------------ ---------------------- ---------------------- ------------------- ------------------ ----------------------
      918231698 11-MAY-16 06.00.40.980 PM              195         1364.80228     609.183405    831.563728                  0                      0                      0          35211.9487             1622.4             6974.40513
      918231698 11-MAY-16 07.00.53.532 PM              129         555.981481     144.348698    441.670271                  0                      0                      0          8682.84496         646.984496             1810.51938
      918231698 11-MAY-16 08.00.05.513 PM               39         91.5794872     39.6675128    54.4575897                  0                      0                      0          3055.17949          63.025641             669.153846
      918231698 12-MAY-16 08.00.32.814 AM               35         178.688971     28.0369429    159.676629                  0                      0                      0          1464.28571              190.8             311.485714
      918231698 12-MAY-16 09.00.44.997 AM              124         649.370258     194.895944    486.875758                  0                      0                      0           13447.871         652.806452             2930.23387
      918231698 12-MAY-16 10.00.57.199 AM              168         2174.35909     622.905935    1659.14223                  0                      0             .001303571          38313.1548         2403.28571             8894.42857
      918231698 12-MAY-16 11.00.09.362 AM              213         3712.60403     1100.01973    2781.68793                  0                      0             .000690141          63878.1362               3951             15026.2066
      918231698 12-MAY-16 12.00.21.835 PM              221         2374.74486      741.20133    1741.28251                  0                      0             .000045249          44243.8914         2804.66063               10294.81
On the new Linux system the query was taking 10 times as long to run as in the HP system.
PLAN_HASH_VALUE END_INTERVAL_TIME         EXECUTIONS_DELTA Elapsed Average ms CPU Average ms IO Average ms Cluster Average ms Application Average ms Concurrency Average ms Average buffer gets Average disk reads Average rows processed
--------------- ------------------------- ---------------- ------------------ -------------- ------------- ------------------ ---------------------- ---------------------- ------------------- ------------------ ----------------------
     2834425987 10-MAY-16 07.00.09.243 PM               41         39998.8871     1750.66015    38598.1108                  0                      0                      0          50694.1463         11518.0244             49379.4634
     2834425987 10-MAY-16 08.00.13.522 PM               33         44664.4329     1680.59361    43319.9765                  0                      0                      0          47090.4848         10999.1818             48132.4242
     2834425987 11-MAY-16 11.00.23.769 AM                8          169.75075      60.615125      111.1715                  0                      0                      0             417.375                 92                2763.25
     2834425987 11-MAY-16 12.00.27.950 PM               11         14730.9611     314.497455    14507.0803                  0                      0                      0          8456.63636         2175.63636             4914.90909
     2834425987 11-MAY-16 01.00.33.147 PM                2           1302.774       1301.794             0                  0                      0                      0               78040                  0                  49013
     2834425987 11-MAY-16 02.00.37.442 PM                1           1185.321       1187.813             0                  0                      0                      0               78040                  0                  49013
     2834425987 11-MAY-16 03.00.42.457 PM               14         69612.6197     2409.27829     67697.353                  0                      0                      0          45156.8571         11889.1429             45596.7143
     2834425987 11-MAY-16 04.00.47.326 PM               16         65485.9254     2232.40963    63739.7442                  0                      0                      0          38397.4375         12151.9375             52222.1875
     2834425987 12-MAY-16 08.00.36.402 AM               61         24361.6303     1445.50141    23088.6067                  0                      0                      0          47224.4426         5331.06557              47581.918
     2834425987 12-MAY-16 09.00.40.765 AM               86         38596.7262     1790.56574    37139.4262                  0                      0                      0          46023.0349         9762.01163             48870.0465
The query plans were not the same but they were similar. Also, the number of rows in our test cases were more than the average number of rows per run in production but it still didn’t account for all the differences.
We decided to use an outline hint and SQL Profile to force the HP system’s plan on the queries in the Linux system to see if the same plan would run faster.
It was a pain to run the query with bind variables that are dates for my test so I kind of cheated and replaced the bind variables with literals. First I extracted some example values for the variables from the original system:
select * from
(select distinct
to_char(sb.LAST_CAPTURED,'YYYY-MM-DD HH24:MI:SS') DATE_TIME,
sb.NAME,
sb.VALUE_STRING
from
DBA_HIST_SQLBIND sb
where
sb.sql_id='aktyyckj710a3' and
sb.WAS_CAPTURED='YES')
order by
DATE_TIME,
NAME;
Then I got the plan of the query with the bind variables filled in with the literals from the original HP system. Here is how I got the plan without the SQL query itself:
truncate table plan_table;

explain plan into plan_table for
-- problem query here with bind variables replaced
/

set markup html preformat on

select * from table(dbms_xplan.display('PLAN_TABLE',
NULL,'ADVANCED'));
This plan outputs an outline hint similar to this:
  /*+
      BEGIN_OUTLINE_DATA
      INDEX_RS_ASC(@"SEL$683B0107"
      ...
      NO_ACCESS(@"SEL$5DA710D3" "VW_NSO_1"@"SEL$5DA710D3")
      OUTLINE(@"SEL$1")
      OUTLINE(@"SEL$2")
      UNNEST(@"SEL$2")
      OUTLINE_LEAF(@"SEL$5DA710D3")
      OUTLINE_LEAF(@"SEL$683B0107")
      ALL_ROWS
      OPT_PARAM('query_rewrite_enabled' 'false')
      OPTIMIZER_FEATURES_ENABLE('10.2.0.3')
      IGNORE_OPTIM_EMBEDDED_HINTS
      END_OUTLINE_DATA
  */
Now, to force aktyyckj710a3 to run on the new system with the same plan as on the original system I had to run the query on the new system with the outline hint and get the plan hash value for the plan that the query uses.
explain plan into plan_table for
  SELECT
    /*+
        BEGIN_OUTLINE_DATA
...
        END_OUTLINE_DATA
    */
  *
    FROM
...
Plan hash value: 1022624069
So, I compared the two plans and they were the same but the plan hash values were different. 1022624069 on Linux was the same as 918231698. I think that endianness differences caused the plan_hash_value differences for the same plan.
Then we forced the original HP system plan on to the real sql_id using coe_xfr_sql_profile.sql.
-- build script to load profile

@coe_xfr_sql_profile.sql aktyyckj710a3 1022624069

-- run generated script

@coe_xfr_sql_profile_aktyyckj710a3_1022624069.sql
Sadly, even after forcing the original system’s plan on the new system, the query still ran just as slow. But, at least we were able to remove the plan difference as the source of the problem.
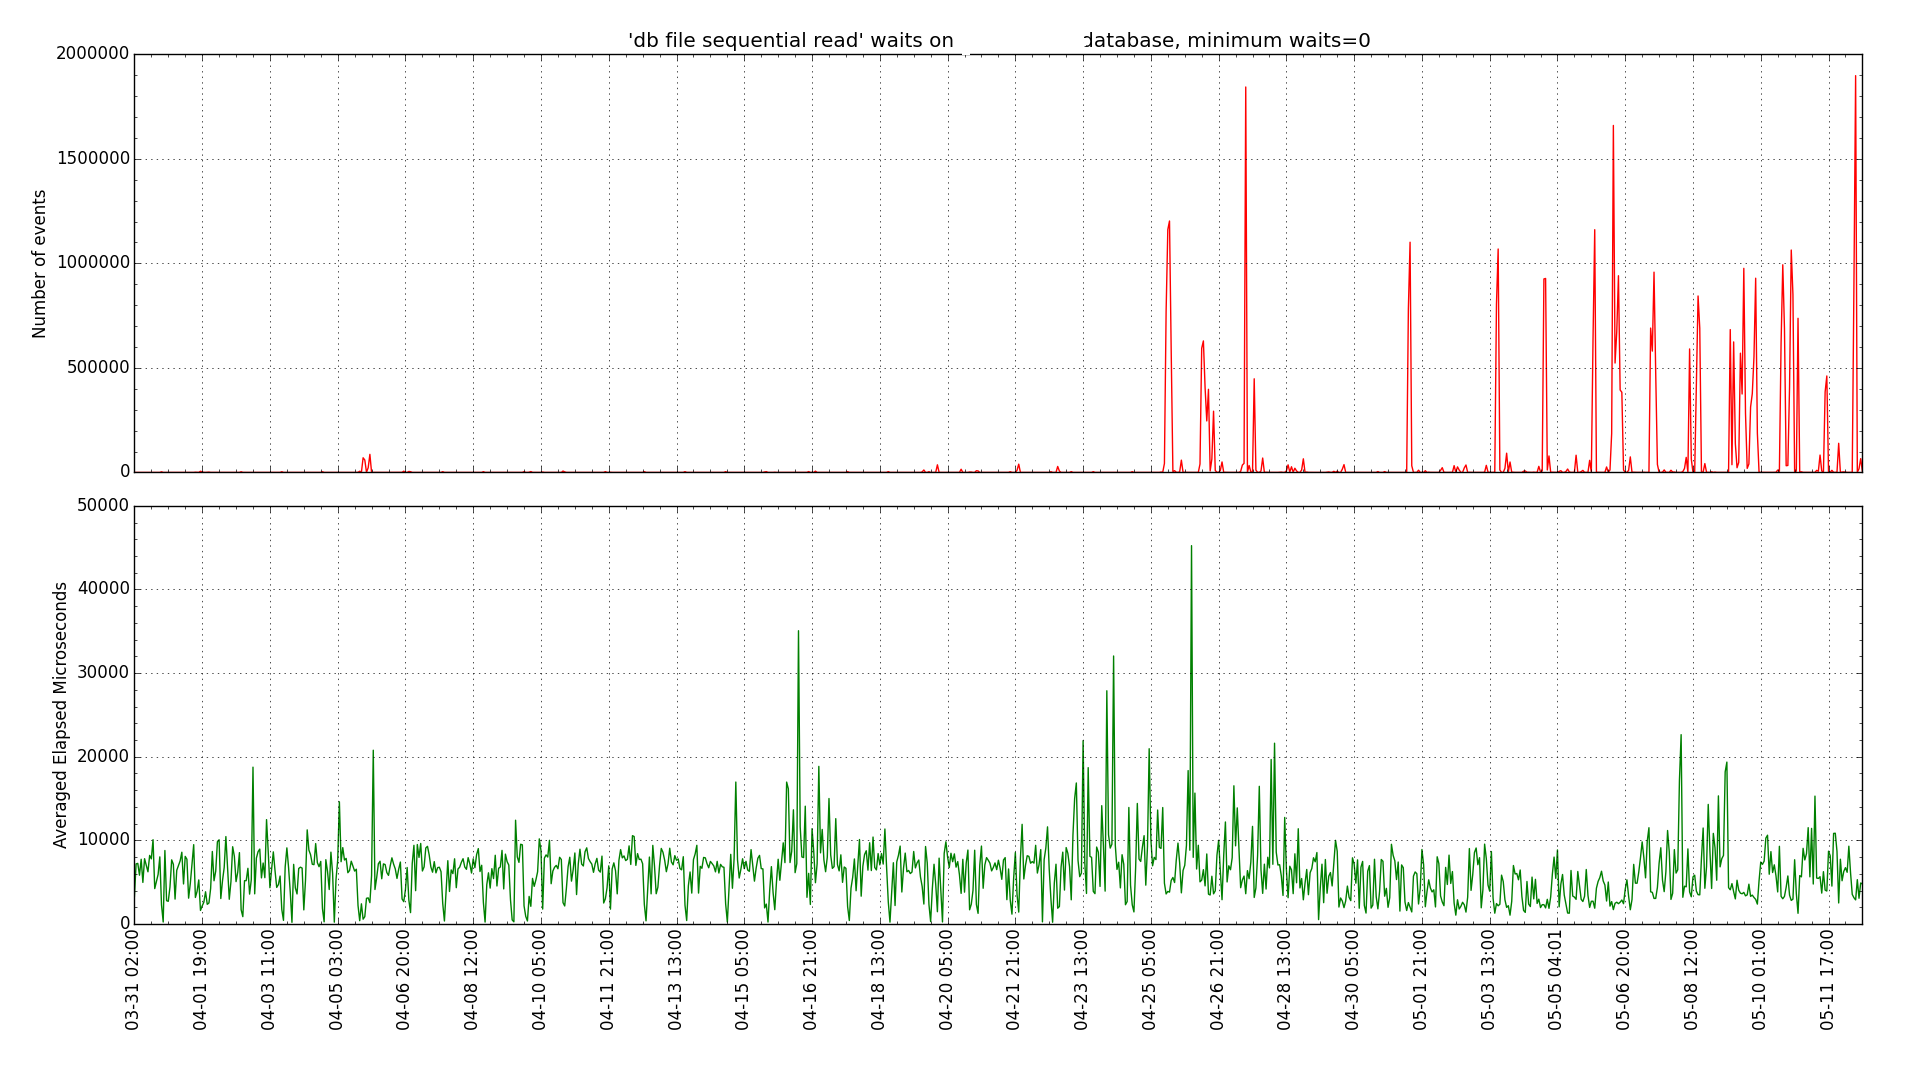
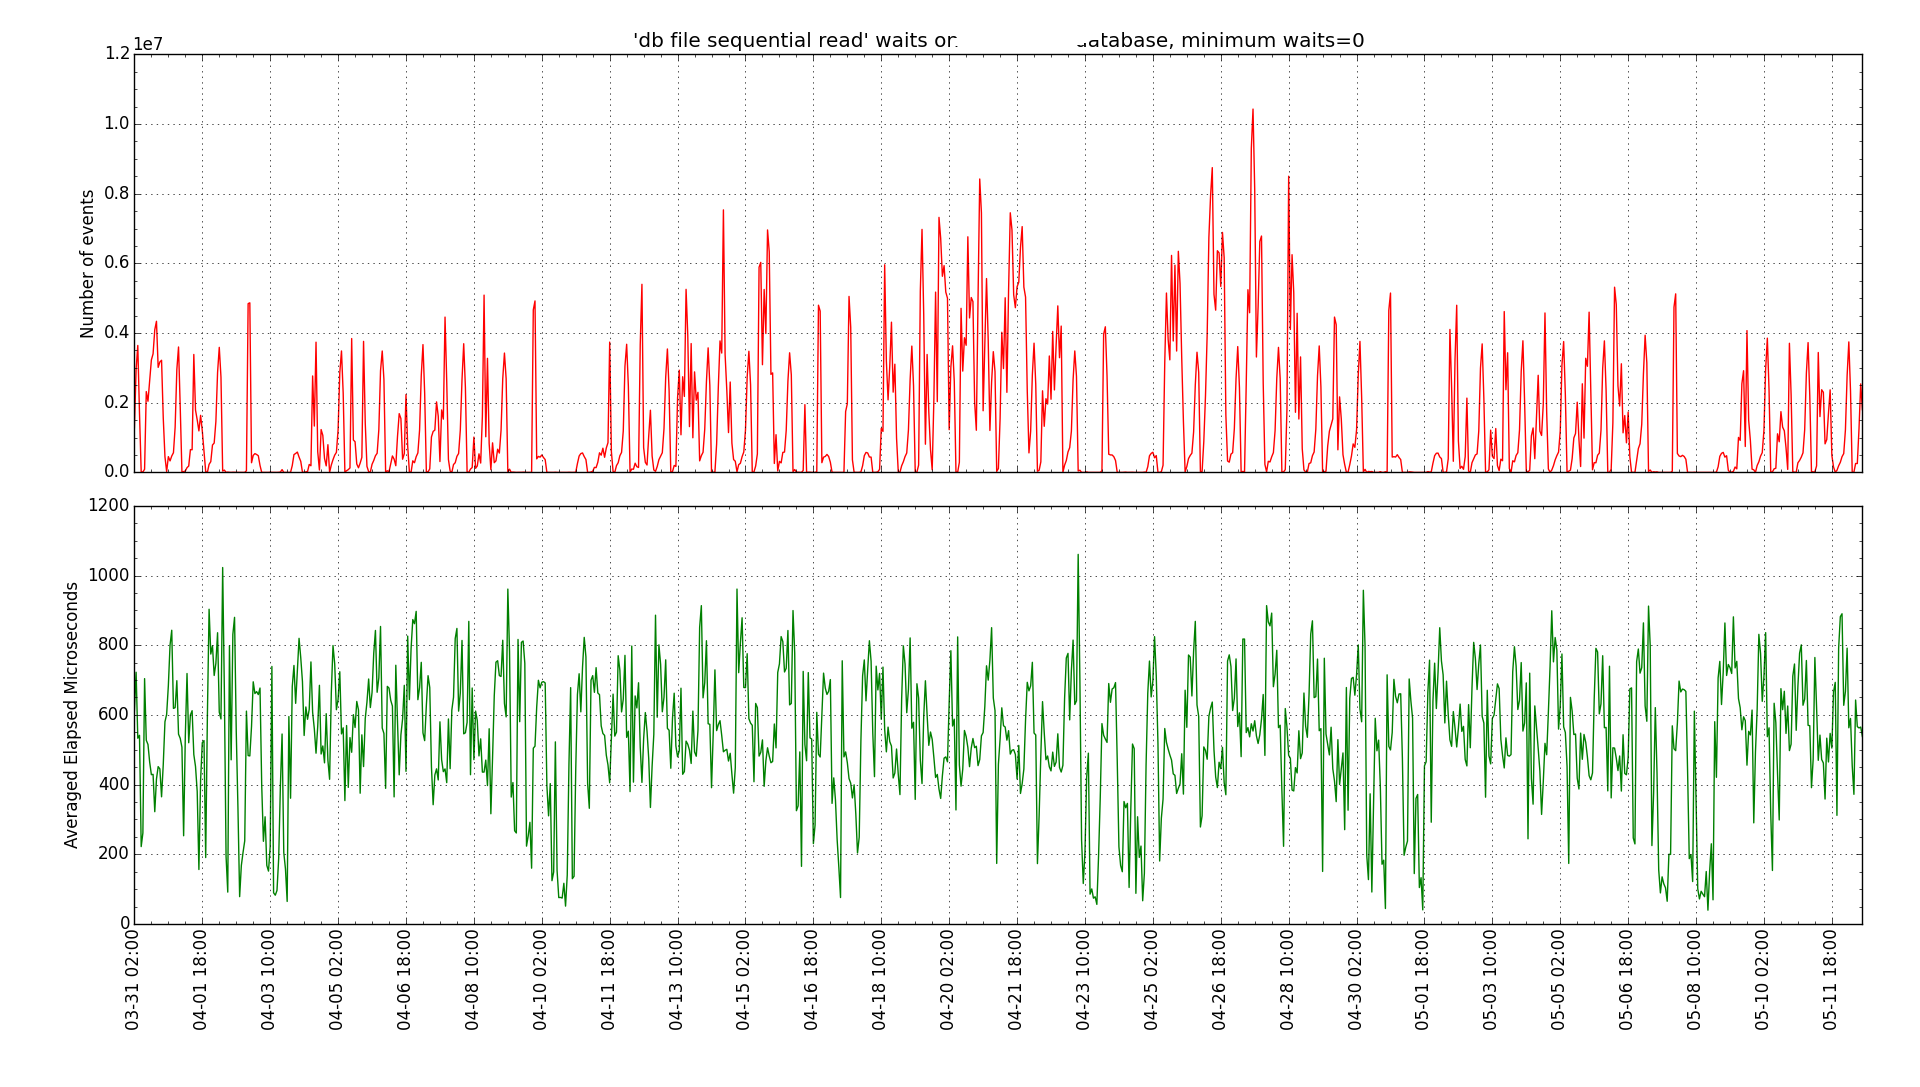
We did notice a high I/O time on the Linux executions. Running AWR reports showed about a 5 millisecond single block read time on Linux and about 1 millisecond on HP. I also graphed this over time using my Python scripts:
Linux db file sequential read (single block read) graph:
HP-UX db file sequential read graph:
So, in general our source HP system was seeing sub millisecond single block reads but our new Linux system was seeing multiple millisecond reads. So, this lead us to look at differences in the storage system. It seems that the original system was on flash or solid state disk and the new one was not. So, we are going to move the new system to SSD and see how that affects the query performance.
Even though this led to a possible hardware issue I thought it was worth sharing the process I took to get there including eliminating differences in the query plan by matching the plan on the original platform.
Bobby
Postscript:
Our Linux and storage teams moved the new Linux VM to solid state disk and resolved these issues. The query ran about 10 times faster than it did on the original system after moving Linux to SSD.
HP Version:

END_INTERVAL_TIME         EXECUTIONS_DELTA Elapsed Average ms
------------------------- ---------------- ------------------
02.00.03.099 PM                        245         5341.99923
03.00.15.282 PM                        250         1280.99632
04.00.27.536 PM                        341         3976.65855
05.00.39.887 PM                        125         2619.58894

Linux:

END_INTERVAL_TIME         EXECUTIONS_DELTA Elapsed Average ms
------------------------- ---------------- ------------------
16-MAY-16 09.00.35.436 AM              162         191.314809
16-MAY-16 10.00.38.835 AM              342         746.313994
16-MAY-16 11.00.42.366 AM              258         461.641705
16-MAY-16 12.00.46.043 PM              280         478.601618

The single block read time is well under 1 millisecond now that
the Linux database is on SSD.

END_INTERVAL_TIME          number of waits ave microseconds
-------------------------- --------------- ----------------
15-MAY-16 11.00.54.676 PM           544681       515.978687
16-MAY-16 12.00.01.873 AM           828539       502.911935
16-MAY-16 01.00.06.780 AM           518322       1356.92377
16-MAY-16 02.00.10.272 AM            10698       637.953543
16-MAY-16 03.00.13.672 AM              193       628.170984
16-MAY-16 04.00.17.301 AM              112        1799.3125
16-MAY-16 05.00.20.927 AM             1680       318.792262
16-MAY-16 06.00.24.893 AM              140       688.914286
16-MAY-16 07.00.28.693 AM             4837       529.759768
16-MAY-16 08.00.32.242 AM            16082       591.632508
16-MAY-16 09.00.35.436 AM           280927       387.293204
16-MAY-16 10.00.38.835 AM           737846        519.94157
16-MAY-16 11.00.42.366 AM          1113762       428.772997
16-MAY-16 12.00.46.043 PM           562258       510.357372
Sweet!


