
I want to document some recent steps that I have been taking to support new development on a transactional system. Every time the system has a new release, if that release includes Oracle SQL changes, I am asked to create and review an AWR report covering the time of a load test (usually several tests) and to see if I see any problems. In the past I looked for longer running application SQL but recently I changed to look at anything that averages over .1 seconds and that has been helpful. So, that is what this post is about. Obviously, if you have faster hardware or different workloads this rule of thumb will not help you. But maybe other higher-volume transactional systems will follow similar patterns.
Here is the top elapsed SQL from a recent load test:
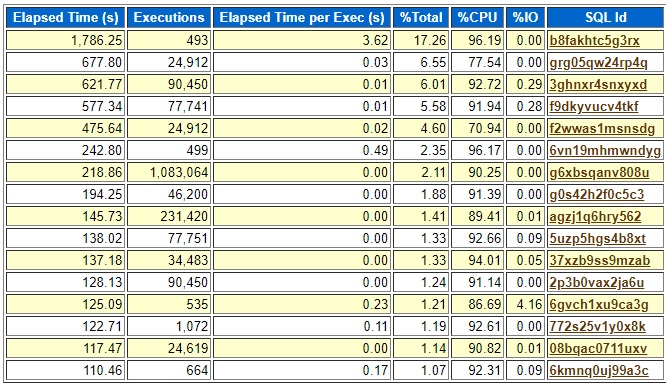
I have only shown some of the columns to hide some details that I do not want to make public. Every SQL here whose “Elapsed Time per Exec (s)” value is above .1 seconds is not part of the application except the last one, 6kmnq0uj99a3c. This was a load test on a non-production system that ramped up a bunch of activity over several hours. This problem query only ran 664 times so if that is representative of how often it runs in production it may not really matter that it is inefficient. But you never know for sure, so I reviewed it anyway. All the queries listed that run in .03, .01, .02, and .00 seconds are representative of the typical queries with good plans on this system. So, that is why .1 ended up standing out. Also, not long ago I found two or three running in production with more than .1 seconds average runtime and they needed new indexes to bring them back under the .1 second threshold. So, for me .1 seconds is the current magical number.
To test it I used two of my scripts.
- bind2.sql – to extract values used in one of the executions
- test2.sql – to find out which table the execution spent the most time on
I replaced the bind variables with constants and ran the query in my test2.sql script and found that most of the time was on a certain range scan on what looked like the correct index. But on closer inspection I realized that a type conversion had prevented the last column of the index from being used. Here is what it looked like with the columns renamed to hide the production names.
filter((TO_NUMBER(MY_NUMBER)="XYZ"."MY_NUMBER" ...
One table has the “MY_NUMBER” column as a character string and the other as a number. So, it was doing a range scan and not a unique scan. I changed the query to convert the number to a character string and the plan used a unique scan.
ABC.MY_NUMBER= to_char(XYZ.MY_NUMBER)
Table ABC was the one that was doing a range scan on three columns and not on MY_NUMBER, the last column in the index. MY_NUMBER is a character column on ABC. XYZ was the other table with MY_NUMBER as a NUMBER type column. I am forcing the conversion of XYZ.MY_NUMBER to a character for the comparison instead of letting the optimizer choose to convert ABC.MY_NUMBER to a number which would suppress the use of the last column of the index on table ABC.
My point was not to talk about implicit type conversions preventing indexes from being used although that is very interesting. My point is that a plan like this that is pretty efficient could run less than .1 seconds if the index was used correctly. And if the application users end up scaling the use of this query way up to thousands or tens of thousands of executions per hour that unique scan could make a huge difference over the range scan without the last column of the index. Your CPUs might be 10 times faster than mine so your threshold might be lower than .1 seconds, but I think the idea is the same. There is some threshold that indicates a simple, frequently used, transactional SQL may not be using the right indexes. Does not apply in all cases but at the moment this is a useful rule of thumb for me.
I had just written the previous paragraphs before getting an email that our QA team had run another load test with the to_char explicit type conversion in place. It did not make as great of an improvement as I expected. Here are some edited outputs from my sqlstat.sql script:
Original query 6kmnq0uj99a3c:
END_INTERVAL_TIME     EXECUTIONS_DELTA Elapsed Average ms

 09-MAR-21 11.00.08 AM               79         171.306696
 09-MAR-21 12.00.35 PM               84         176.152667
 09-MAR-21 01.00.03 PM               80         178.420588
 09-MAR-21 02.00.32 PM               80         171.877913
 09-MAR-21 03.00.01 PM               81         174.509975
 09-MAR-21 04.00.29 PM               83         180.367157
New query 2ndfgypwp3qf0 with the to_char to allow the unique index scan:
END_INTERVAL_TIME     EXECUTIONS_DELTA Elapsed Average ms

 12-MAR-21 09.00.15 AM               80         107.822088
 12-MAR-21 10.00.44 AM               83         104.453446
 12-MAR-21 11.00.12 AM               81          105.34042
 12-MAR-21 12.00.42 PM               80          103.05625
 12-MAR-21 01.00.12 PM               79         106.738557
 12-MAR-21 02.00.42 PM               82         101.285183
 12-MAR-21 03.00.12 PM               81         105.172531
Kind of disappointing. I expected a greater improvement based on my testing. Still, .1 seconds per execution is better than .17. Maybe if the tables grow with more data over time this improvement will be greater.
Even though this query did not turn out to have a dramatic improvement I did find a way to improve the plan. My .1 seconds cutoff pointed me to a query that did not have the ideal use of indexes and lead to an improvement in performance. In other cases, in the past I have seen 20x improvements so it is worth reviewing the ones over .1 seconds.
Bobby

Hi chandler.
As per your analysis is this the only sql id-6kmnq0uj99a3c you found it to be using the bad plan and you have changed the where clause predicates from
filter((TO_NUMBER(MY_NUMBER)=”XYZ”.”MY_NUMBER” TO
ABC.MY_NUMBER= to_char(XYZ.MY_NUMBER)
to use the unique index where the elapsed time has been improvement.
Do you have the same analysis for the other remaining sql_id’s or is it the user who reported issue with the sql query with Sql-id-6kmnq0uj99a3c.
thanks
Goutham.
Goutham,
Thank you for your comment. What I did not show in the image of the AWR report is that to the right of the last column that I showed is other information like the text of the SQL and information about the connection. I did not want to show that information on the internet. Anyway, I knew that the other SQL_ID values that had average elapsed time > .1 seconds were not part of the application based on that information that you cannot see in the post.
My development and testing team performs load tests and then tells me the name of the database and the start and stop date and time and I do an AWR report that covers the time of the load test and I try to identify any problems without them telling me that one of the SQL_IDs is too slow. So that is I why I have to come up with some way to tell which ones are of concern. The problem is that a query that runs in .17 seconds like 6kmnq0uj99a3c might seem fine. But if it ends up being executed 10,000 times per hour in production then it might cause the application to slow down. So, I have a rough guideline for myself to investigate SQL’s with > .1 seconds average elapsed time to see if they have a problem.
Thanks again for your comment and I hope my explanation of my thinking is clear and helpful.
Bobby