
I helped resolve an Oracle database performance problem yesterday and I thought I would capture what I did in this blog post. It is a “simple” problem in that the solution was easy once I understood the issue and because this sort of problem happens often. But the process to get to the solution is not completely simple. I think documenting the process may have more value than writing down the details of this specific problem.
Today is Tuesday. Thursday last week our development team was doing some testing and performance of the system was terrible. I was busy working on another project that is my primary assignment right now, so I did not look at it. It was also Thursday before the July 4th holiday weekend and we are all mentally and physically checking out a bit early. Some key people were already off on vacation. So, we shut it all down until Monday (yesterday). Also, late Thursday there was some thought that there was a system issue maybe with our virtual machines’ host or networking. So, we let it go. Monday our dev team said they thought the slowness was caused by bad data including duplicates that were throwing errors on a target system (non-Oracle) in the cloud. So, they cleaned up the data and started a new run. But it was slow as molasses and the application front end was also super slow.
In retrospect, looking at the paragraph above, I bet a lot of DBAs with performance tuning experience would jump to the solution. I can think off the top of my head of a few types of things that might cause these symptoms. But I did not immediately think of it so I went through a process to get there. No leap of intuition was required except maybe at the very end.
Since the problem query was currently running the first step was to look at the session monitor in Toad. I may have looked at HP Unix’s Glance tool, which is like Top, to see the CPU usage and top processes at an OS level. What I saw was a parallel query running with 8 parallel child processes and the query had been running about 30 seconds.
Step two was to take an AWR report. First, I ran a command like this to get a snapshot after the current activity:
exec dbms_workload_repository.create_snapshot;Then I ran an AWR report for the last two snapshots.
The “SQL ordered by Elapsed Time” part of the report looked like this:
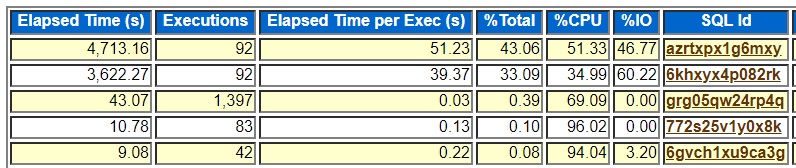
The top query azrtxpx1g6mxy was the one I saw in Toad. The second query is a subselect of the top one. Averaging 51.23 seconds and having 46.77% of its time on I/O I eventually went where I usually go with AWR reports. I went to the “Segments by Logical Reads” section of the AWR report. Here is part of that section:
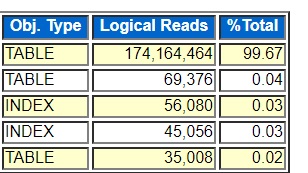
I hid the table names, but the point is that the top segment was doing 99.67% of the logical I/Os. So, the issue had to do with I/O. But looking at the “Top 5 Timed Foreground Events” section I/O seems very efficient.
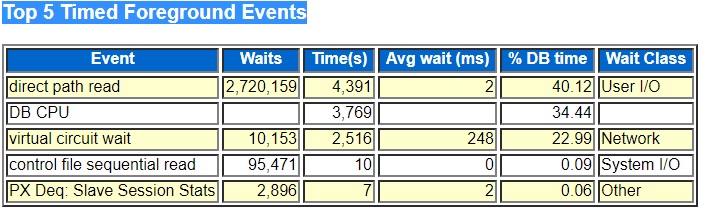
The top wait was the I/O event “direct path read” which can be deceptively low on systems that use asynchronous I/O. But this system uses HP Unix file system I/O which does not support asynchronous I/O so the direct path read number is correct. One of my list of possible things that could be wrong before I started was some sort of I/O contention but this report pointed away from I/O hardware.
So, the AWR report and my look at Toad session monitor points to a SQL statement doing parallel query full scans of a table and that SQL statement running 10s of seconds in length. So, I looked at the execution plan next. I like to use my getplans.sql SQL*Plus script to extract a query’s plan from the AWR using its SQL_ID. I ran this is SQL*Plus:
@getplans azrtxpx1g6mxySure enough, the same top table was running a parallel full table scan in the plan.
Somewhere in this process I did some counts. I think the simplicity of using select count(*) queries may get in the way of people using it but count(*) queries are one of the biggest helps to me tuning a SQL statement. I did two types of counts for this case. I did a select count(*) on the top table and found out that it had 160 million rows. The count took 45 seconds even through it was doing a fast full scan of an index and not the full table. Then I queried grouping by the column that joins the table to its parent table. This is a typical header detail join where the child table joins the parent on the parent’s unique key. Then I got the idea that the query might run faster if there were an index on the joining column.
I ran my optimizer statistics scripts to check the index columns and to look at the column statistics to see how selective the joining column is. I found that there was no index on the column that the header table used to join to the problem detail table. So, I recommended that the dev team add an index on that column and including the other columns in the where clause for good measure. They might have to try two or three different column choices and orders to get the best index.
But the dev team was skeptical. This same query runs fine in production. It is not new so what changed? I tried running my sqlstat.sql script to get a history of the execution of SQL_ID azrtxpx1g6mxy but there was no history on our test system going back before July 2nd. I ran it on production and there was no history at all. I found out that this SQL had not run for two months on production and since we only keep 6 weeks history in our AWR any execution history of azrtxpx1g6mxy had fallen off the list.
Finally, I had a moment of insight. If I could have seen a faster plan on production, no insight would have been required. It would have been an almost mechanical process of comparing the good and bad plans. But I finally got the idea of running my same optimizer statistics scripts against production and looking at the indexes. Sure enough, production had an index on the joining column. Duh! I probably should have checked for differences between the tables and indexes in test and prod first, but I had no reason to suspect a difference. So, a coworker put the indexes back in test and everything was fine.
So, it is a simple thing. Indexes were dropped on a test system. Happens all the time. Not profound. But maybe the process of driving from problem statement through the different kinds of evidence and tools to the solution is more profound. It gets results. What does the AWR report point to? The top segments pointed to a table. The counts and column statistics suggested the need for an index. Finally, a compare of prod and test showed that an index was missing.
Bobby

Hello Bobby, thanks for the post, it’s always interesting to follow someone else’s train of though.
I was wondering though, why after you saw what the slow session was doing, you got to AWR and not, say, (g)v$sql_monitor? In my opinion, it’s easier to target single sql statement from there and find deficiencies in execution plans
Thanks for your question. I wanted to see if the query was behaving differently than it had in the past or on production. So, I took an AWR snapshot to get all the current activity on the AWR then used my queries that use DBA_HIST_SQLSTAT to see their history. You can see if the plan changed or if something else changed like the number of rows returned per execution.
That said, I probably should use V$SQL_MONITOR and other V$ views more for tuning currently running SQL statements. I have just been more focused on looking at SQL execution history on DBA_HIST_SQLSTAT.
Also, to test the problem query I used the gather_plan_statistics hint and dbms_xplan.display_cursor with the ALLSTATS option to see the same sort of rowcount information that you could see in V$SQL_MONITOR if I remember correctly.
Anyway, I think I am just used to working on history so I use that same approach on currently running problems. Might not be the best approach for everyone to use. It is just what I have been doing.
Thanks again for your comment and question.
Bobby
Good one!
The best DBA I personally know when it comes to performance doesn’t have any magic scripts or tools, in fact he has all of it shared, but his thinking process and troubleshooting insights are what really makes him great at it.
Once you have the proposed solution or fix, it usually leads to comments like “of course!” or “that one was easy!” just like your case there.
Thanks for your comment. I agree that the process and ideas are what really matters and not the tools. It is a challenge for me to try to put what I do into words on this blog but it is probably good for me to try to explain it to others because it helps me understand it myself. It is really true that in hindsight things seem simple (hindsight is 20/20). 🙂
Thanks again for taking part in this blog.
Bobby