
This week I investigated an issue with a query that was suddenly a lot slower in one test environment than another. It runs about 2 seconds in the good case as well as in production. But it was now running more than 10 seconds which is painfully slow through the GUI and impacting the team’s ability to finish a software release. I was able to figure out that the query was running a worse plan and get it to run the good plan and helped the team finish their testing.
I thought I would write this blog post documenting the tools that I used and my reasoning while trying to resolve the issue. This post may be redundant with some of my other posts because they document similar tools and approaches, but I thought it could not hurt to put together a complete example. I considered just writing about one part of the process to focus in on that, but I thought I would write a longer post instead that shows the overall process with details along the way. This blog is my experience as an Oracle Database Administrator/Architect, and I work for an individual company so my experiences may not apply to everyone else’s situation. You may work somewhere that has licensed different versions or features of the Oracle database so your choices would be different. But I still can put out there what I am doing and let others apply it to their situation as they can. Also, there are lots of very sharp and hardworking Oracle people out there that write about these same topics and have contributed their own tools to the Oracle community so I wonder about the value of putting my tools on GitHub and writing about how I use them. Why not use their tools and their approaches? Maybe they will work better? Sure, but I know that my approach and tools work well for me. Also most of the ideas I use came from books, talks, and posts by the same sharp people that I have in mind so my approach really reflects my translation of ideas that are out there in the Oracle community with additions of my own so it is not a choice of me versus them. Anyway, I thought I would work through this example on this post so others can review it and find value where they can. Inevitably I will get a lot out of writing it down myself and it will help me remember what I was thinking at this time when I read this post in the future. Hopefully others will benefit as well.
Here is what I knew when I first looked at the problem. A coworker emailed me the SQL for the problem query and verified that the tables in both test environments were about the same size. Sometimes our test environments can be much smaller than production and different from each other in terms of data volume. Usually, when I get a performance question, I ask for two things: the name of the database and the date and time that the issue stopped and started, including time zone. In this case I knew the database name but not the time frame. But I figured that they had been working on it during the current day, so I just got an AWR report for that day from 8 am to present assuming they worked roughly in working hours.
Fortunately, the AWR report had the problem query as the top query so I did not have trouble finding it. It helped that I already knew the text of the SQL statement. The main thing I got from the AWR report at first is the SQL_ID value. I already had the SQL text, but it helps to get the SQL_ID to plug into other scripts I used.
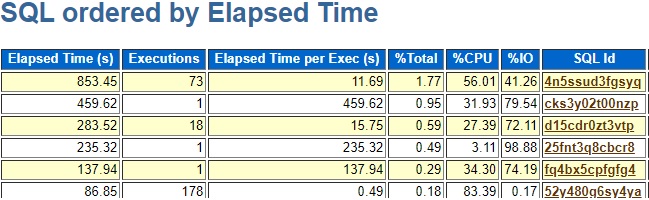
My next step was to run my sqlstat.sql script to see if the problem query, 4n5ssud3fgsyq, has changed plans. Not sure why I did not use the updated version, sqlstat3.sql. I manually updated the query with the SQL_ID value:
where ss.sql_id = '4n5ssud3fgsyq'and then I looked for plan changes in the output:
I use the PLAN_HASH_VALUE as a name for the plan. I verified that the good plan, 65249283, was run on the other test server that was fine and that it was used in production. So, I had to figure out why the plan changed to 2414495514 on this one test server.
At some point in this process I paused and considered using a SQL Profile to just force the plan back to the good plan. I have written a number of posts about SQL Profiles but this did not seem like a situation where one made sense. Why not spend a couple hours trying to figure out why the plan changed? If I use a SQL Profile, then I will have to migrate the profile to production. And if the query changes the tiniest bit in a future release the SQL Profile will no longer be valid. I have one situation where we have a partitioned table with some almost empty partitions and queries that access the table with the partitioning column passed into the where clause as bind variables. I have been using SQL Profiles to handle that situation on this particular set of production and test databases, but it is a big pain. The last release I had to redo 7-9 SQL Profiles. I’m probably going to have to bite the bullet and find another way around it rather than updating profiles when a release modifies the affected queries. Probably will have to fake the stats on the empty partitions or see if they can be removed. I doubt I will be able to get development to take the partitioning columns out of bind variables. I guess some set of hints might work as well. But anyway, the point is that in this situation that this particular post is about I decided to dig into it and try to find the underlying problem instead of using a SQL Profile band aid.
Having decided to move forward with figuring out why the plan changed I next looked at the two plans. I used my getplans.sql script to extract the plans from the AWR based on SQL_ID and PLAN_HASH_VALUE. I just ran this when logged into the problem database using sqlplus:
@getplans 4n5ssud3fgsyqI noticed that the slow plan did full table scans on two tables that the fast plan did index lookups on.
SQL_ID 4n5ssud3fgsyq
--------------------
...
Plan hash value: 65249283 - GOOD PLAN

----------------------------------------------------------
| Id  | Operation                             | Name     |
----------------------------------------------------------
...
|  16 |     TABLE ACCESS BY INDEX ROWID       | TABLE1   |
|  17 |      INDEX RANGE SCAN                 | TABLE1_2 |
...
|  47 |           TABLE ACCESS BY INDEX ROWID | TABLE2   |
|  48 |            INDEX UNIQUE SCAN          | TABLE2_0 |


Plan hash value: 2414495514 - BAD PLAN

----------------------------------------------------------
| Id  | Operation                             | Name     |
----------------------------------------------------------
...
|  16 |     TABLE ACCESS FULL                 | TABLE1   |
...
|  48 |           TABLE ACCESS FULL           | TABLE2 	 |
----------------------------------------------------------
I also looked at the Segments part of the AWR report and TABLE2 was at the top of the logical and physical reads reports.
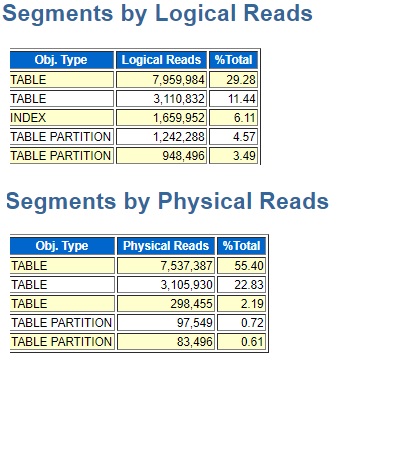
So, at this point in my attempt to understand why the plan changed I have the clue that the bad plan has full table scans, and that one of the two tables with the full scans has a substantial percentage of the overall I/O on the database. So, I had two ideas in mind. First, I wanted to check that the two tables had the same indexes as on the working system. Maybe the indexes got dropped during some development work. If the indexes were there, I could just look at the optimizer statistics for the two tables and compare them to what they have on the working test system and production.
I use my optimizer statistics scripts to look at indexes and information that the optimizer uses to choose the best plan. I know that there are other ways to get the same information, such as in a graphical program like Toad or OEM, but I like having scripts that give me exactly the information that I know is important. It is a little clunky to use but not difficult. The top level script is all.sql and I usually comment out the calls to scripts that produce an excessive amount of output. I probably should put all.sql out like this in GitHub:
@tablelist.sql
--@colpartstats.sql
@columnstats.sql
--@histograms.sql
@indexcolumns.sql
@indexstats.sql
--@indpartstats.sql
--@parthists.sql
@tablestats.sql
@tabpartstats.sql
@tabsubpartstats.sql
Seeing all the histogram information for every partition on a table with thousands of partitions is a lot of output and not really needed. If you have many subpartitions you might comment out tabsubpartstats.sql also. To use these scripts you just put your table owners and names in tablelist.sql and run all.sql. The script indexstats.sql listed out the indexes and statistics on them and indexcolumns.sql showed what columns the indexes were on. Unfortunately, in this case the indexes and their columns were the same for the two full scan tables on both test environments and on production. So the switch of the plan to full scans was not due to the lack of indexes. These tables were not partitioned so the tablestats.sql and columnstats.sql reports were the main ones I looked at to compare statistics. Maybe one of them had very out of date or even missing statistics. Unfortunately, the statistics on the two tables looked pretty similar on all three databases. So, my look at the indexes and statistics of the two tables with full scans on the bad plan did not explain the change in plan.
At some point in this process I decided to run the problem query to see if it gave me clues about the plan change. I am putting this post together remembering the steps I went through, but I may not have the exact chronological order. But I should be able to capture the main things I thought about in an order that makes sense. In order to test the query, I needed to come up with values for the bind variables. I used my bind2.sql script to extract some of the bind variable values on the problem test database. I edited bind2.sql to have the problem SQL_ID, 4n5ssud3fgsyq. I chose the most recent two sets of bind variable values to plug into the problem query. I extracted the query text using dumpsql.sql and used Toad to format it nicely. Then I plugged the formatted query into my test2.sql script. To use test2.sql you need to replace the select statement that is there on GitHub:
SELECT /*+gather_plan_statistics*/ * from dual where dummy <> ' ';with your own query. But you have to make sure that the gather_plan_statistics hint stays in the select statement. There are different ways to handle bind variables and their values in a test script like this but in this case, I manually edited the test script replacing the bind variables with literals that I got from bind2.sql. I chose two sets because one set had nulls for a couple of values so I thought the nulls might cause the bad plan. There might be some odd choice of bind variable values on this test system that was causing the bad plan, or so I thought. But I ran the test2.sql script as described and it ran slow on the one test system for both sets of bind variable values and fast on the other.
My tests with the bind variable values showed that the problem was not related to those sets of bind variable values and that even with literals in place the problem query runs slow on the problem test database. The plan was not the same as the bad plan I had extracted for the original query, but it still had the two full scans. In the same way, my tests had index lookups on the two tables on the other test environment even with the literals replacing the bind variables. So, all this really proved so far was that the two sets of bind variable values that I chose did not affect the problem.
To go further I started looking at the output of test2.sql. The way I get the plan here shows estimated and actual rows. If I find discrepancies in estimated and actual row counts that could point me to where the problem lies. This query in test2.sql dumps out the plan in a format that shows estimated and actual rows:
select * from table(dbms_xplan.display_cursor(null,null,'ALLSTATS'));Here is the edited output for the bad plan for the two full scan tables:
----------------------------------------------------------------------------------------
| Id  | Operation                    | Name    | Starts | E-Rows | A-Rows |   A-Time   |
----------------------------------------------------------------------------------------
...
|  16 |     TABLE ACCESS FULL        | TABLE1  |      2 |   1593K|   3186K|00:00:01.36 |
...
|  48 |           TABLE ACCESS FULL  | TABLE2  |      2 |   1628K|   3344K|00:00:15.13 |
----------------------------------------------------------------------------------------
But I am not sure what this is telling me. For TABLE1 the optimizer expected 1593K rows and got 3186K. It expected 1.5 million rows but got 3 million. Similarly, about 1.6 million and 3.3. But how does this help me figure out what the problem is? I looked at the good plan in the same way but was equally puzzled:
-------------------------------------------------------------------------------------
| Id  | Operation                             | Name     | Starts | E-Rows | A-Rows |
-------------------------------------------------------------------------------------
...
|  16 |     TABLE ACCESS BY INDEX ROWID       | TABLE1   |      0 |      1 |      0 |
|* 17 |      INDEX RANGE SCAN                 | TABLE1_2 |      0 |      1 |      0 |
...
|  47 |           TABLE ACCESS BY INDEX ROWID | TABLE2   |      0 |      1 |      0 |
|* 48 |            INDEX UNIQUE SCAN          | TABLE2_0 |      0 |      1 |      0 |
-------------------------------------------------------------------------------------
Here the estimated rows is 1 but actual is 0. But how do I use that to figure out what changed the plan on the one test environment? Then I got the key insight to solve this whole thing. It was not new to me, but I don’t do this every day and it was a good reminder and I wanted to blog about it. I considered blogging about just this one point and maybe I should edit this post down to just this idea. But then I wouldn’t put out the overall steps and tools I used to get to this point. The key insight was to use a full set of outline hints to force the bad plan and good plan to run in both environments and to compare the estimated and actual rows with each plan. I am not sure how this post will end but that is the most important point. Presumably the optimizer considered both plans and gave each of them a cost and chose the lowest cost plan to run. On our problem system the much slower plan has a lower cost than the faster one. The opposite is true on the working systems. What we want is to force the query to run the bad plan both places and see where the estimated rows differ. Then do the same for the good plan. A key idea that I learned about query tuning from people like Tom Kyte, Jonathan Lewis, and others is that the optimizer chooses a bad plan because of bad row estimates or bad estimates of the cost per row of certain operations. Most of the time it comes down to bad row estimates. So, which table is getting the bad row estimates and why? My way of finding it out in this case was to use outline hints to force the same plan to run on both databases and then use the test2.sql output to look at estimated and actual rows.
I was not sure how to extract the plans from the AWR and get the outline hints. I’m sure there is a way but in my hurry I ended up just using my plan.sql script to use EXPLAIN PLAN to get the plan and pull the outline hint from there. I checked the plans to make sure they had the same index versus full scan issues as I have been seeing. At the end of the output for plan.sql is an outline hint section that starts like this:
Outline Data
-------------

  /*+
      BEGIN_OUTLINE_DATA
You just copy and paste everything from /*+ through */ as your hint. I put this in my test2.sql script that I had used before with one set of the bind variable values as constants and I merged the gather_plan_statistics hint with the outline hint so the query started like this:
 SELECT /*+gather_plan_statistics
      BEGIN_OUTLINE_DATA
This way the gather_plan_statistics hint collects the actual and estimated rows and the outline hint forces the plan to be used.
At first, I looked at the estimated and actual rows on the good and bad plans on both systems for the two tables that switched to full scans on the problem system.
Good DB Bad Plan Full Scan Tables

------------------------------------------------------------------------------------
| Id  | Operation                             | Name    | Starts | E-Rows | A-Rows |
------------------------------------------------------------------------------------
...
|  16 |     TABLE ACCESS FULL                 | TABLE1  |      1 |   1590K|   1593K|
...
|  48 |           TABLE ACCESS FULL           | TABLE2  |      1 |   1957K|   1957K|
------------------------------------------------------------------------------------

Bad DB Bad Plan Full Scan Tables

Plan hash value: 1397976319

------------------------------------------------------------------------------------
| Id  | Operation                             | Name    | Starts | E-Rows | A-Rows |
------------------------------------------------------------------------------------
...
|  16 |     TABLE ACCESS FULL                 | TABLE1  |      1 |   1593K|   1593K|
...
|  48 |           TABLE ACCESS FULL           | TABLE2  |      1 |   1628K|   1672K|
------------------------------------------------------------------------------------

Good DB Good Plan Full Scan Tables

-------------------------------------------------------------------------------------
| Id  | Operation                             | Name     | Starts | E-Rows | A-Rows |
-------------------------------------------------------------------------------------
...
|  16 |     TABLE ACCESS BY INDEX ROWID       | TABLE1   |     16 |      1 |     18 |
|* 17 |      INDEX RANGE SCAN                 | TABLE1_2 |     16 |      1 |     18 |
...
|  47 |           TABLE ACCESS BY INDEX ROWID | TABLE2   |     12 |      1 |     12 |
|* 48 |            INDEX UNIQUE SCAN          | TABLE2_0 |     12 |      1 |     12 |
-------------------------------------------------------------------------------------

Bad DB Good Plan Full Scan Tables

-------------------------------------------------------------------------------------
| Id  | Operation                             | Name     | Starts | E-Rows | A-Rows |
-------------------------------------------------------------------------------------
...
|  16 |     TABLE ACCESS BY INDEX ROWID       | TABLE1   |     16 |      1 |     18 |
|* 17 |      INDEX RANGE SCAN                 | TABLE1_2 |     16 |      2 |     18 |
...
|  47 |           TABLE ACCESS BY INDEX ROWID | TABLE2   |     12 |      1 |     11 |
|* 48 |            INDEX UNIQUE SCAN          | TABLE2_0 |     12 |      1 |     11 |
-------------------------------------------------------------------------------------
No obvious pattern shows up on these to me. It seems like the optimizer has the same estimates for these two tables on both databases for both plans. But then I got the second key idea: look at the other tables. It is typical when a plan switches to a full scan for there to be something wrong with that table’s stats. But nothing pointed to that in this situation. So, I got the idea of stepping back and looking at the other tables. That led to me finding the actual issue. Two tables that were not the ones with the full scans had different degrees of discrepancies between actual and estimated rows on the bad and good databases.
Good DB Bad Plan Other Tables

-------------------------------------------------------------------------------------
| Id  | Operation                             | Name     | Starts | E-Rows | A-Rows |
-------------------------------------------------------------------------------------
...
|  12 |        TABLE ACCESS BY INDEX ROWID    | TABLE3   |      1 |      3 |      6 |
|* 13 |         INDEX RANGE SCAN              | TABLE3_1 |      1 |      3 |      6 |
|  14 |      TABLE ACCESS BY INDEX ROWID      | TABLE4   |      6 |     55 |     11 |
|* 15 |       INDEX RANGE SCAN                | TABLE4_1 |      6 |     55 |     11 |
...
-------------------------------------------------------------------------------------

Bad DB Bad Plan Other Tables

-------------------------------------------------------------------------------------
| Id  | Operation                             | Name     | Starts | E-Rows | A-Rows |
-------------------------------------------------------------------------------------
...
|  12 |        TABLE ACCESS BY INDEX ROWID    | TABLE3   |      1 |     22 |      6 |
|* 13 |         INDEX RANGE SCAN              | TABLE3_1 |      1 |     22 |      6 |
|  14 |      TABLE ACCESS BY INDEX ROWID      | TABLE4   |      6 |    153 |     11 |
|* 15 |       INDEX RANGE SCAN                | TABLE4_1 |      6 |    153 |     11 |
...
-------------------------------------------------------------------------------------

Good DB Good Plan Other Tables

----------------------------------------------------------------------------------
| Id  | Operation                          | Name     | Starts | E-Rows | A-Rows |
----------------------------------------------------------------------------------
...
|  12 |        TABLE ACCESS BY INDEX ROWID | TABLE3   |      1 |      3 |      6 |
|* 13 |         INDEX RANGE SCAN           | TABLE3_1 |      1 |      3 |      6 |
|  14 |      TABLE ACCESS BY INDEX ROWID   | TABLE4   |      6 |     55 |     11 |
|* 15 |       INDEX RANGE SCAN             | TABLE4_1 |      6 |     55 |     11 |

----------------------------------------------------------------------------------

Bad DB Good Plan Other Tables

----------------------------------------------------------------------------------
| Id  | Operation                          | Name     | Starts | E-Rows | A-Rows |
----------------------------------------------------------------------------------
...
|  12 |        TABLE ACCESS BY INDEX ROWID | TABLE3   |      1 |     22 |      6 |
|* 13 |         INDEX RANGE SCAN           | TABLE3_1 |      1 |     22 |      6 |
|  14 |      TABLE ACCESS BY INDEX ROWID   | TABLE4   |      6 |    153 |     11 |
|* 15 |       INDEX RANGE SCAN             | TABLE4_1 |      6 |    153 |     11 |
...
----------------------------------------------------------------------------------
Looking at these two tables the bad database had significantly higher row estimates than the good database and the actual rows was the same on both. Errors in estimated rows multiply through the plan as joins are considered. So, at this point I thought it could be that the estimates on these tables (TABLE3 and TABLE4) led to the switch to full scans on TABLE1 and TABLE2. So, I went back to my optimizer statistics scripts and took TABLE1 and 2 out of tablelist.sql and put TABLE3 and 4 in and looked for differences. I found the difference in the columnstats.sql output. The NUM_BUCKETS value for the first column of TABLE3 and TABLE4 was 1 on the bad database and 254 or 255 on the good. So, column statistics had been gathered differently on these two tables on the bad database at some point. Maybe in the process of testing or developing on this system statistics were gathered in a non-standard way. The database in question uses Oracle’s default statistics job. (This is 11.2.0.3, HP Unix Itanium by the way). So, I thought I would try gathering statistics on the two tables with dbms_stats.gather_table_stats with default options because that would be similar to what the default stats job would do. I did something like this:
execute dbms_stats.gather_table_stats('MYSCHEMA','TABLE3');

execute dbms_stats.gather_table_stats('MYSCHEMA','TABLE4');
After gathering stats on the two tables I verified that the first column of each had a 254/5 bucket histogram. Then I just tested the problem query on both, and they ran the same fast plan. Then the development team tested through the application and verified that it was back to normal. I flushed the shared pool before turning it over to them in case the bad plan was cached.
This problem was a little tricky because the stats were wrong on two tables that were not the ones that switched to full scans. A lot of times the situation is simpler such as a table is missing statistics altogether. But I thought it would be helpful to work through a description of the process that I took to get to that point and the tools that I used. The key point is the one I put in bold above which is to look at the estimated and actual rows for the same plan on both databases and look for differences. Once I did that it was just a matter of finding the tables with the different estimates on the two dbs. That led me to look at their statistics and to regather them in a better way. It took a little time to figure this out, but it was nice to find the problem and do the least amount of change necessary to resolve the issue instead of just randomly trying things. Sometimes people will just gather stats on all the tables in the query. That probably would have worked here if they gathered them in the right way. Or you could just use a SQL Profile and forget trying to figure out why the new plan popped up. But it was worthwhile to understand why the plan changed in this case. For one thing I was concerned whether the same plan change would happen in production, so I wanted to know why it changed on the test environment. Knowing that the two tables had statistics gathered on them in a way that we would not use in production I have more confidence that prod is fine. There really is value in digging into why a query’s plan has changed but it does take some work. Often the bad plan is a result of a bad row estimate in some part of the plan and it makes sense to track down which table has the bad row estimate and dig into why the estimate was off. In many cases bad row estimates relate to how and when statistics were gathered on the problem table as was the case with our two tables in this situation.
P.S. sqlstat3.sql no longer exists. Here is my post about how I merged my sqlstat scripts:
https://www.bobbydurrettdba.com/2020/04/14/fixed-issue-with-dba_hist_sqlstat-script/

Very nice article!
Thanks!
Bobby