
I have uploaded a zip of my two RMOUG Training Days talks here: zip
During the Toastmasters talk there was a question about finding a club in your area.
Here is how to find a Toastmasters club near you. Go to www.toastmasters.org and click on the FIND A CLUB button. Enter your address or zip and you get a map with club locations like this:
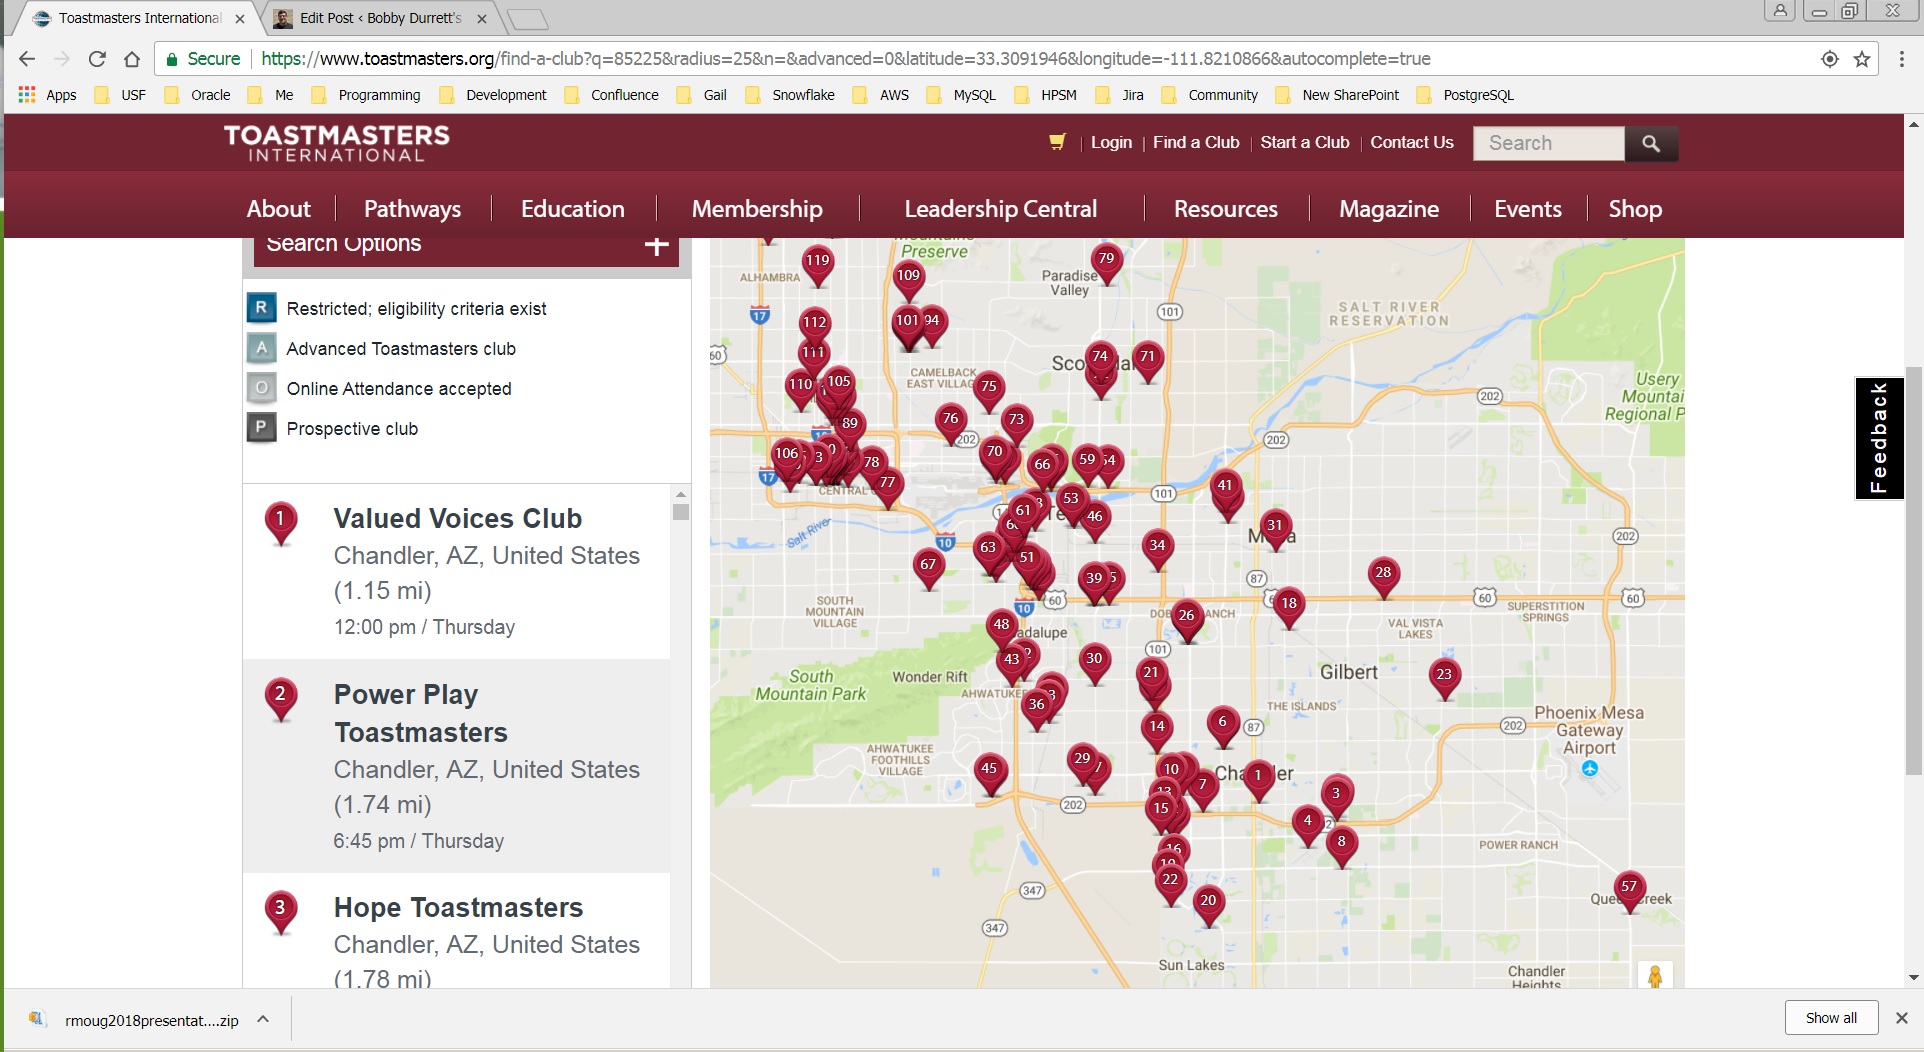
Click on the club to see details of when it meets and whether they are open to new members.
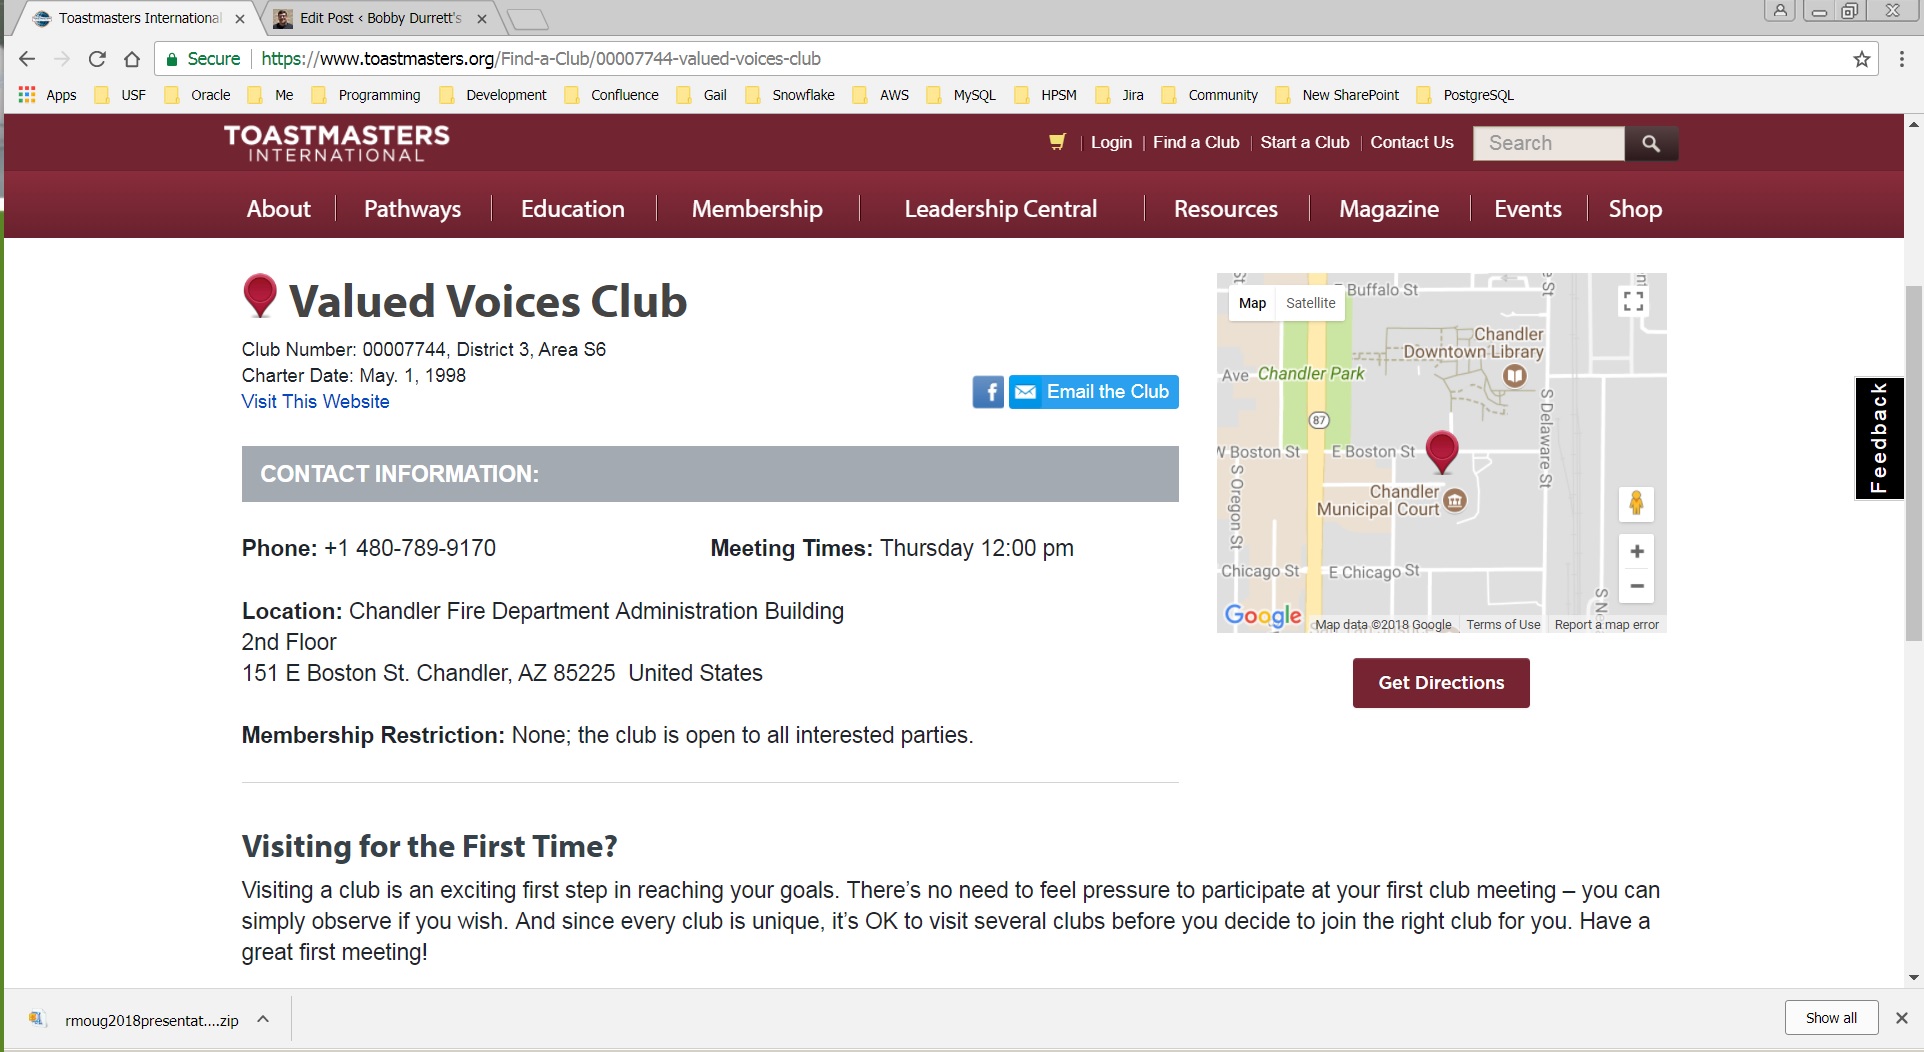
You can call the phone number and you can visit their website if they have one.
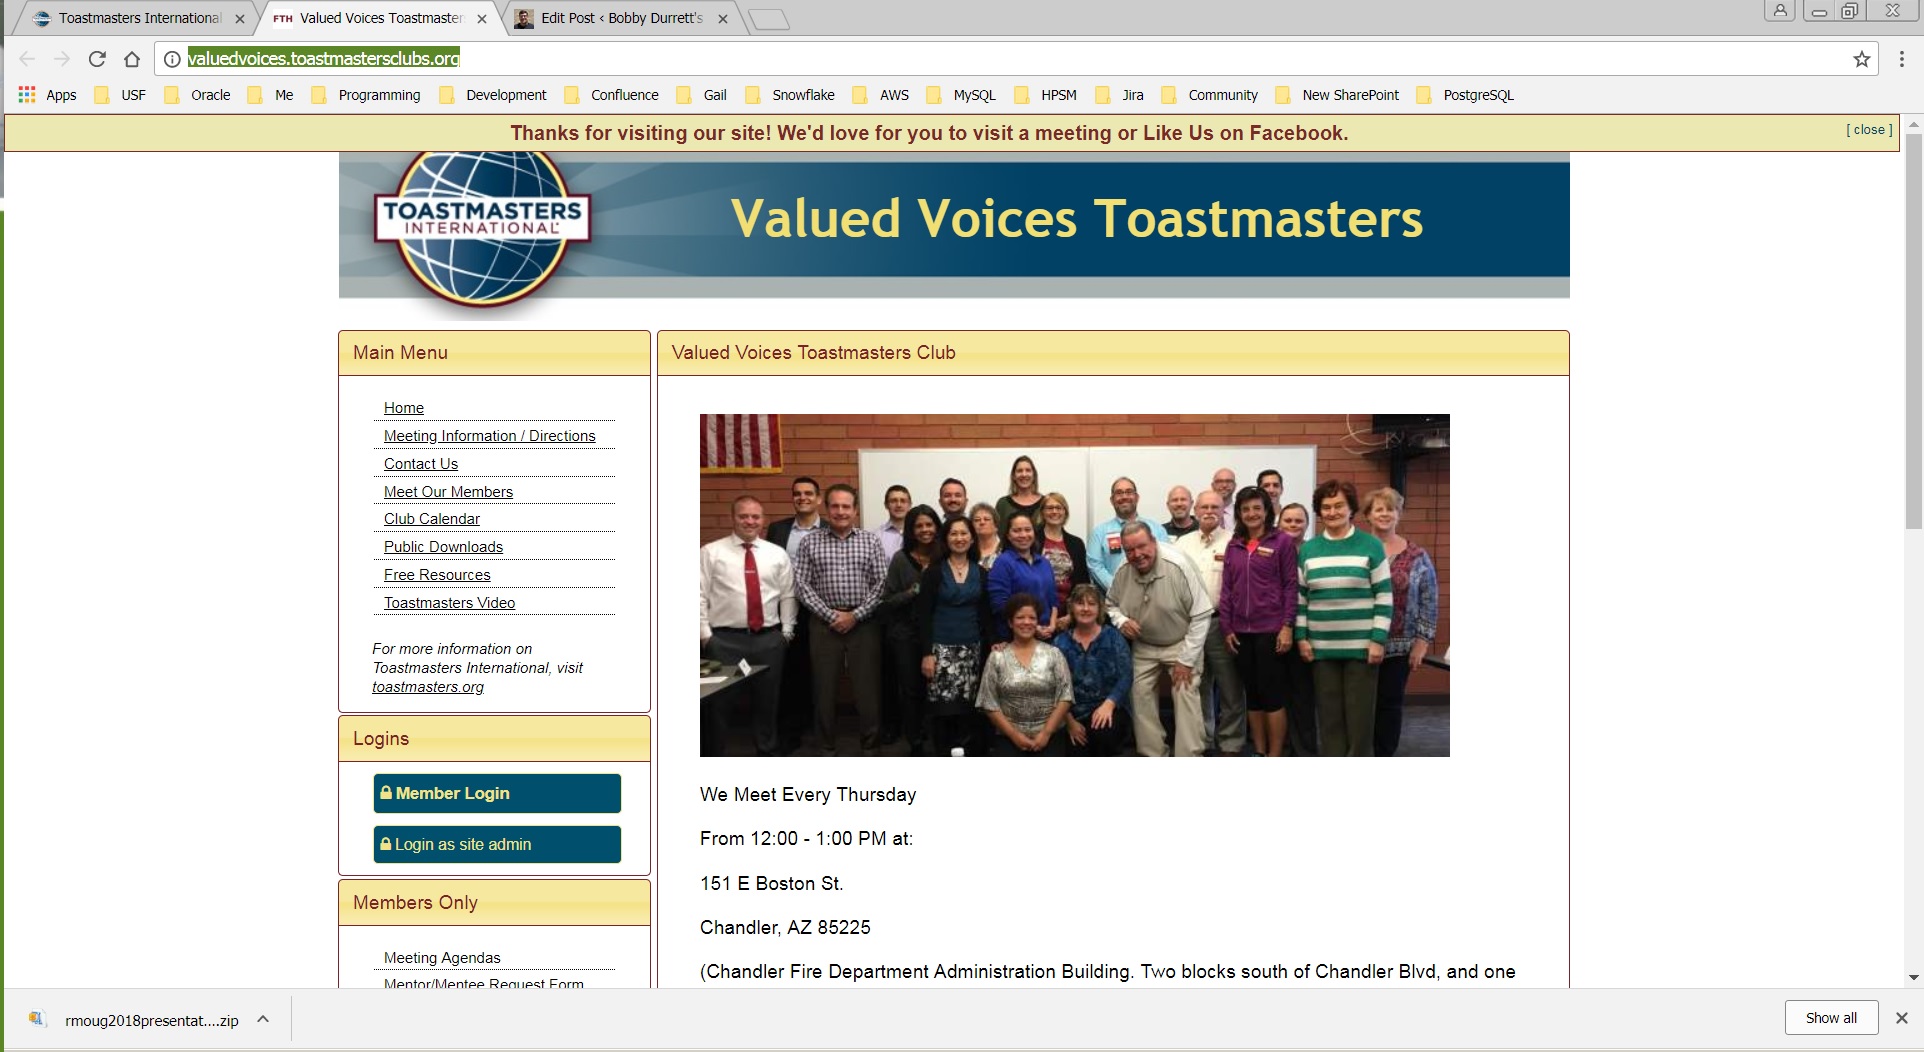
Toastmasters provides clubs with hosting for sites like this so it is easy to find out where they meet and to ask questions. In a public club like the one in this example you can just show up at a meeting and they will welcome you. A corporate club will often be just for employees so unless you work for the company that hosts the club you probably will have to look elsewhere. But there are a ton of clubs and most would love to have new members.
At the Python presentation people wanted to look at my PythonDBAGraphs source code. It is on GitHub here: PythonDBAGraphs. This is my largest example of Python code that an Oracle DBA might write. I think that the Oracle community may find PythonDBAGraphs more useful as an example than as a practical application. I use it every day for my work so it has value but it is more command line and less finished than a product that you would buy. Still, it shows how to use Python with Oracle databases and how to graph things using Python. And, it is a fairly simple yet still useful example of Python code.
The README.md has a lot of these details but I thought I would point people to the source files that might be most helpful to them as examples.
db.py has the Oracle database routines using the cx_Oracle module.
myplot.py has the graphing routines using the Matplotlib module.
util.py has some general functions that read or write from files, prompt for input from the command line, or process command line arguments.
The rest of the files are each one graph. I use these in the same way that I use the command line sqlplus scripts that I use for performance tuning. For each graph there is some code for stitching together a SQL query to get information from DBA_HIST or V$ views. Then each one calls routines in db.py, myplot.py, and util.py to do the rest. I tried to put as much logic as possible in db.py, myplot.py, and util.py so that it would be easy to quickly create a new graph.
onewait.py is an example of a single graph.
A lot of this information is in other blog posts but I thought I would put it here based on the questions that I got from doing the Python talk at RMOUG Training Days.
Anyway, I wanted to publish the PowerPoint files and give these two follow ups based on the questions that I got after each talk.
Bobby
