
I got a chance to use my onewait Python based graph to help with a performance problem. I’m looking at slow write time from the log writer on Thursday mornings. Here is the graph with the database name erased:
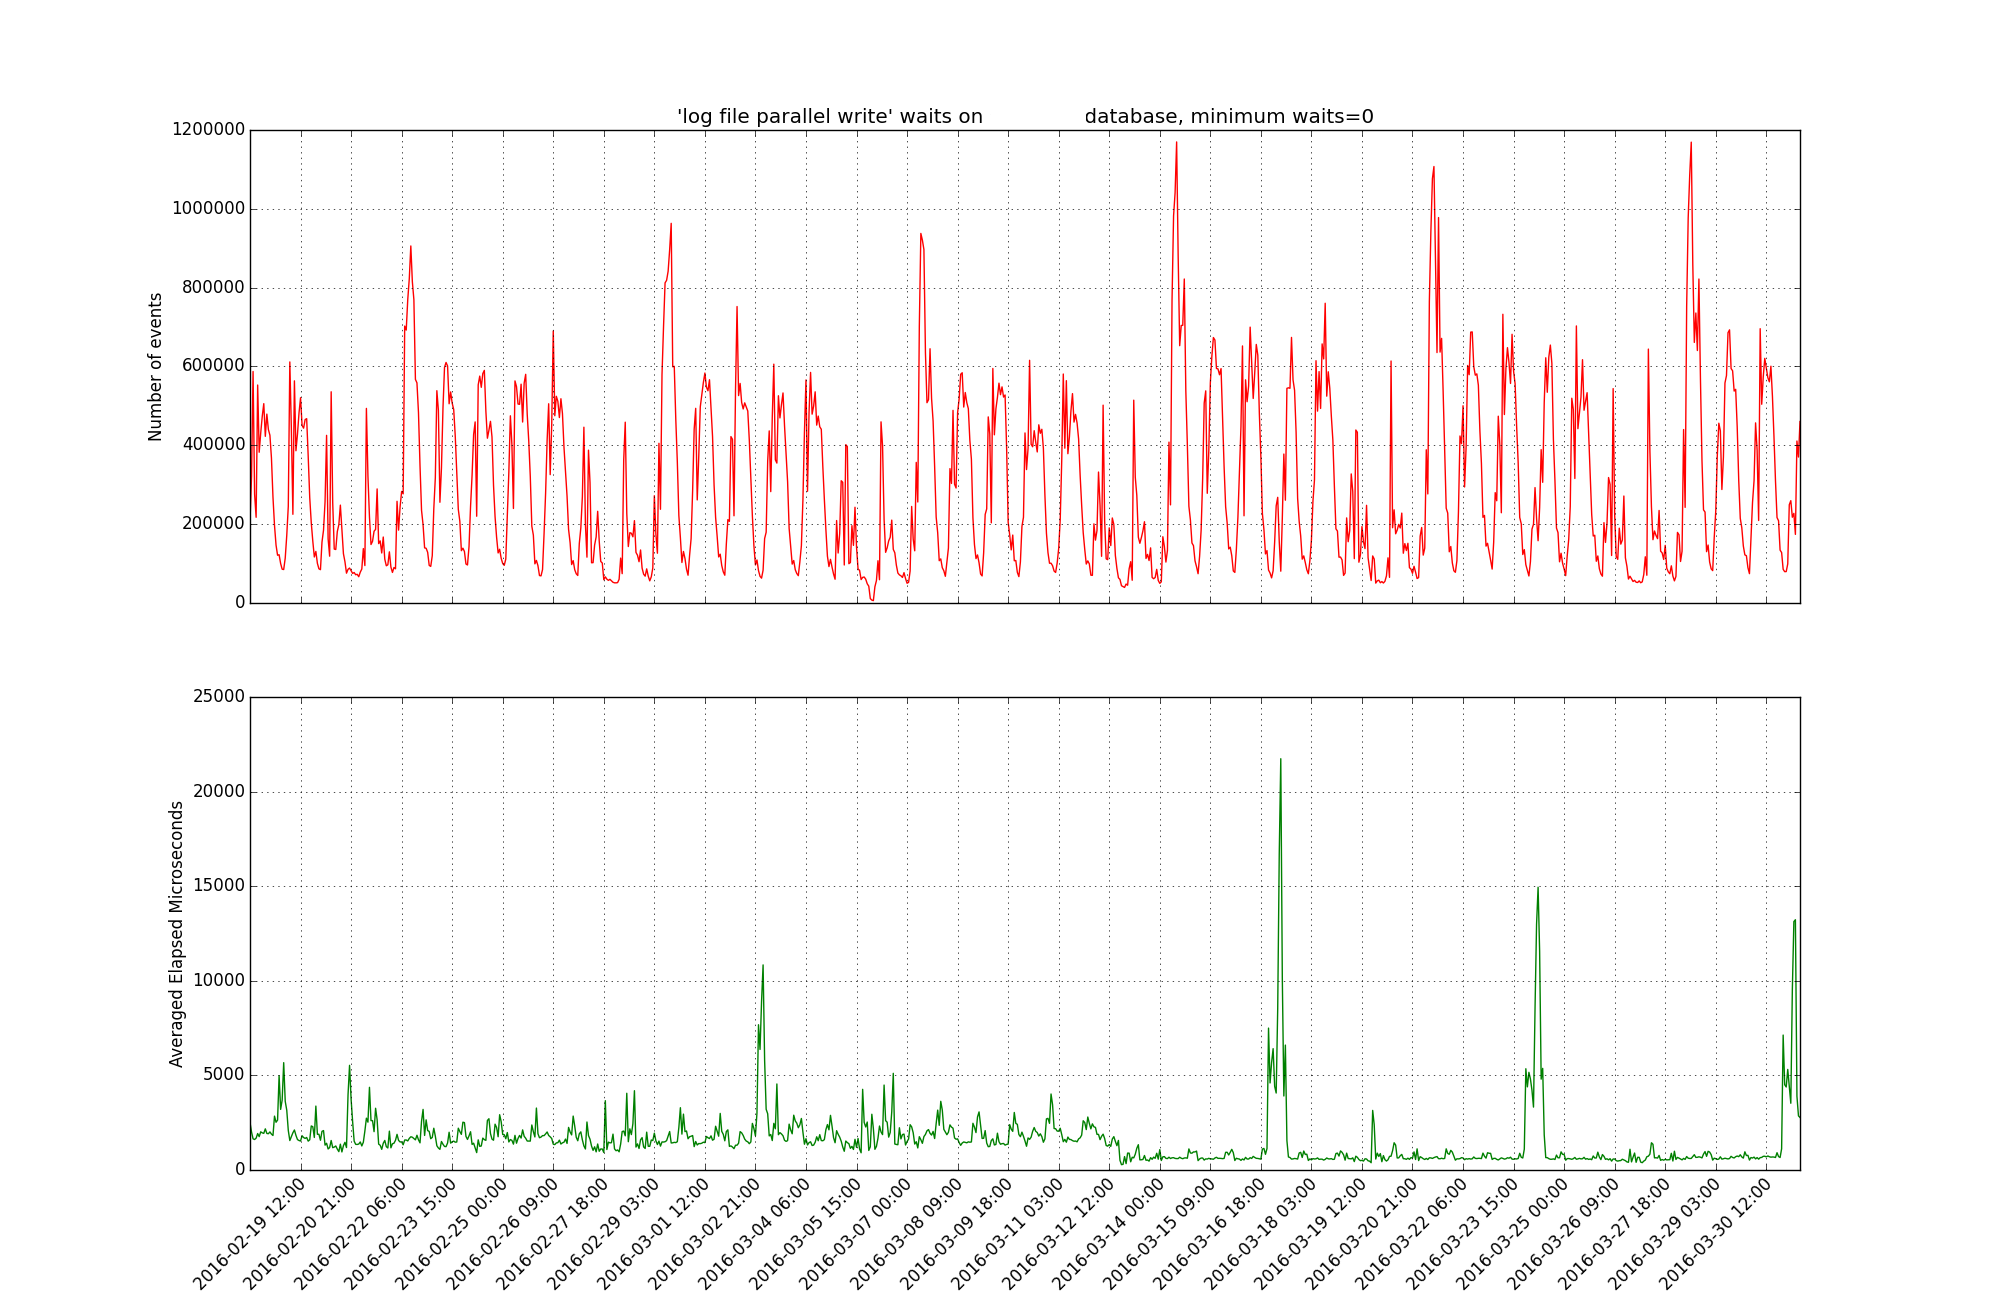
We are still trying to track down the source of the problem but there seems to be a backup on another system that runs at times that correspond to the spike in log file parallel write wait times. The nice thing about this graph is that it shows you activity on the top and average wait time on the bottom so you can see if the increased wait time corresponds to a spike in activity. In this case there does not seem to be any increase in activity on the problematic database. But that makes sense if the real problem is contention by a backup on another system.
Anyway, my Python graphs are far from perfect but still helpful in this case.
Bobby
